What is zymtrace?

zymtrace is a continuous profiling solution designed to optimize both general-purpose and GPU-accelerated workloads. It provides deep, actionable performance insights into applications, LLM inference, and AI agents—all without requiring code modifications, recompilation, instrumentation, or system restarts.

At its core, zymtrace identifies the most expensive lines of code and CUDA operations across your fleet and recommends solutions to fix them. Its unique ability to provide whole-system visibility enables engineers to trace performance issues from high-level application code through GPU instructions and into the Linux kernel.

By correlating GPU hardware profiles with CPU code paths, zymtrace transforms how organizations identify and resolve performance bottlenecks, improving the efficiency of heterogeneous computing environments.

zymtrace revolutionizes how engineers can optimize their modern heterogeneous infrastructure by:

  • Providing unified visibility across GPU and CPU workloads, from inference to AI agents to general applications
  • Translating complex performance data into clear, actionable recommendations that guide your optimization efforts
  • Making advanced performance optimization accessible to every engineer, not just hardware specialists
  • Enabling zero-friction observability powered by eBPF—no code changes, no restarts, no instrumentation required

Landing page

An Inference Use-Case

When running inference with a PyTorch model on an NVIDIA GPU, zymtrace provides a detailed view of the operation flow and resource consumption across the entire software and hardware stack. It profiles the execution path from the Python inference service through PyTorch operations, the ATen/C++ layer, CUDA API calls like cublasSgemm and cuLaunchKernel, down to GPU instructions, tracking execution, memory usage, and stall reasons.

This capability is particularly valuable for organizations transitioning from traditional CPU-based computing to GPU acceleration. By using zymtrace, they can maximize their infrastructure efficiency while avoiding common performance pitfalls.

Our vision extends beyond visibility. zymtrace aims to translate this complexity into actionable recommendations, helping engineers identify and resolve performance bottlenecks with ease.

Supported Stack

  • GPU Acceleration: NVIDIA CUDA
  • Machine Learning Framework: PyTorch
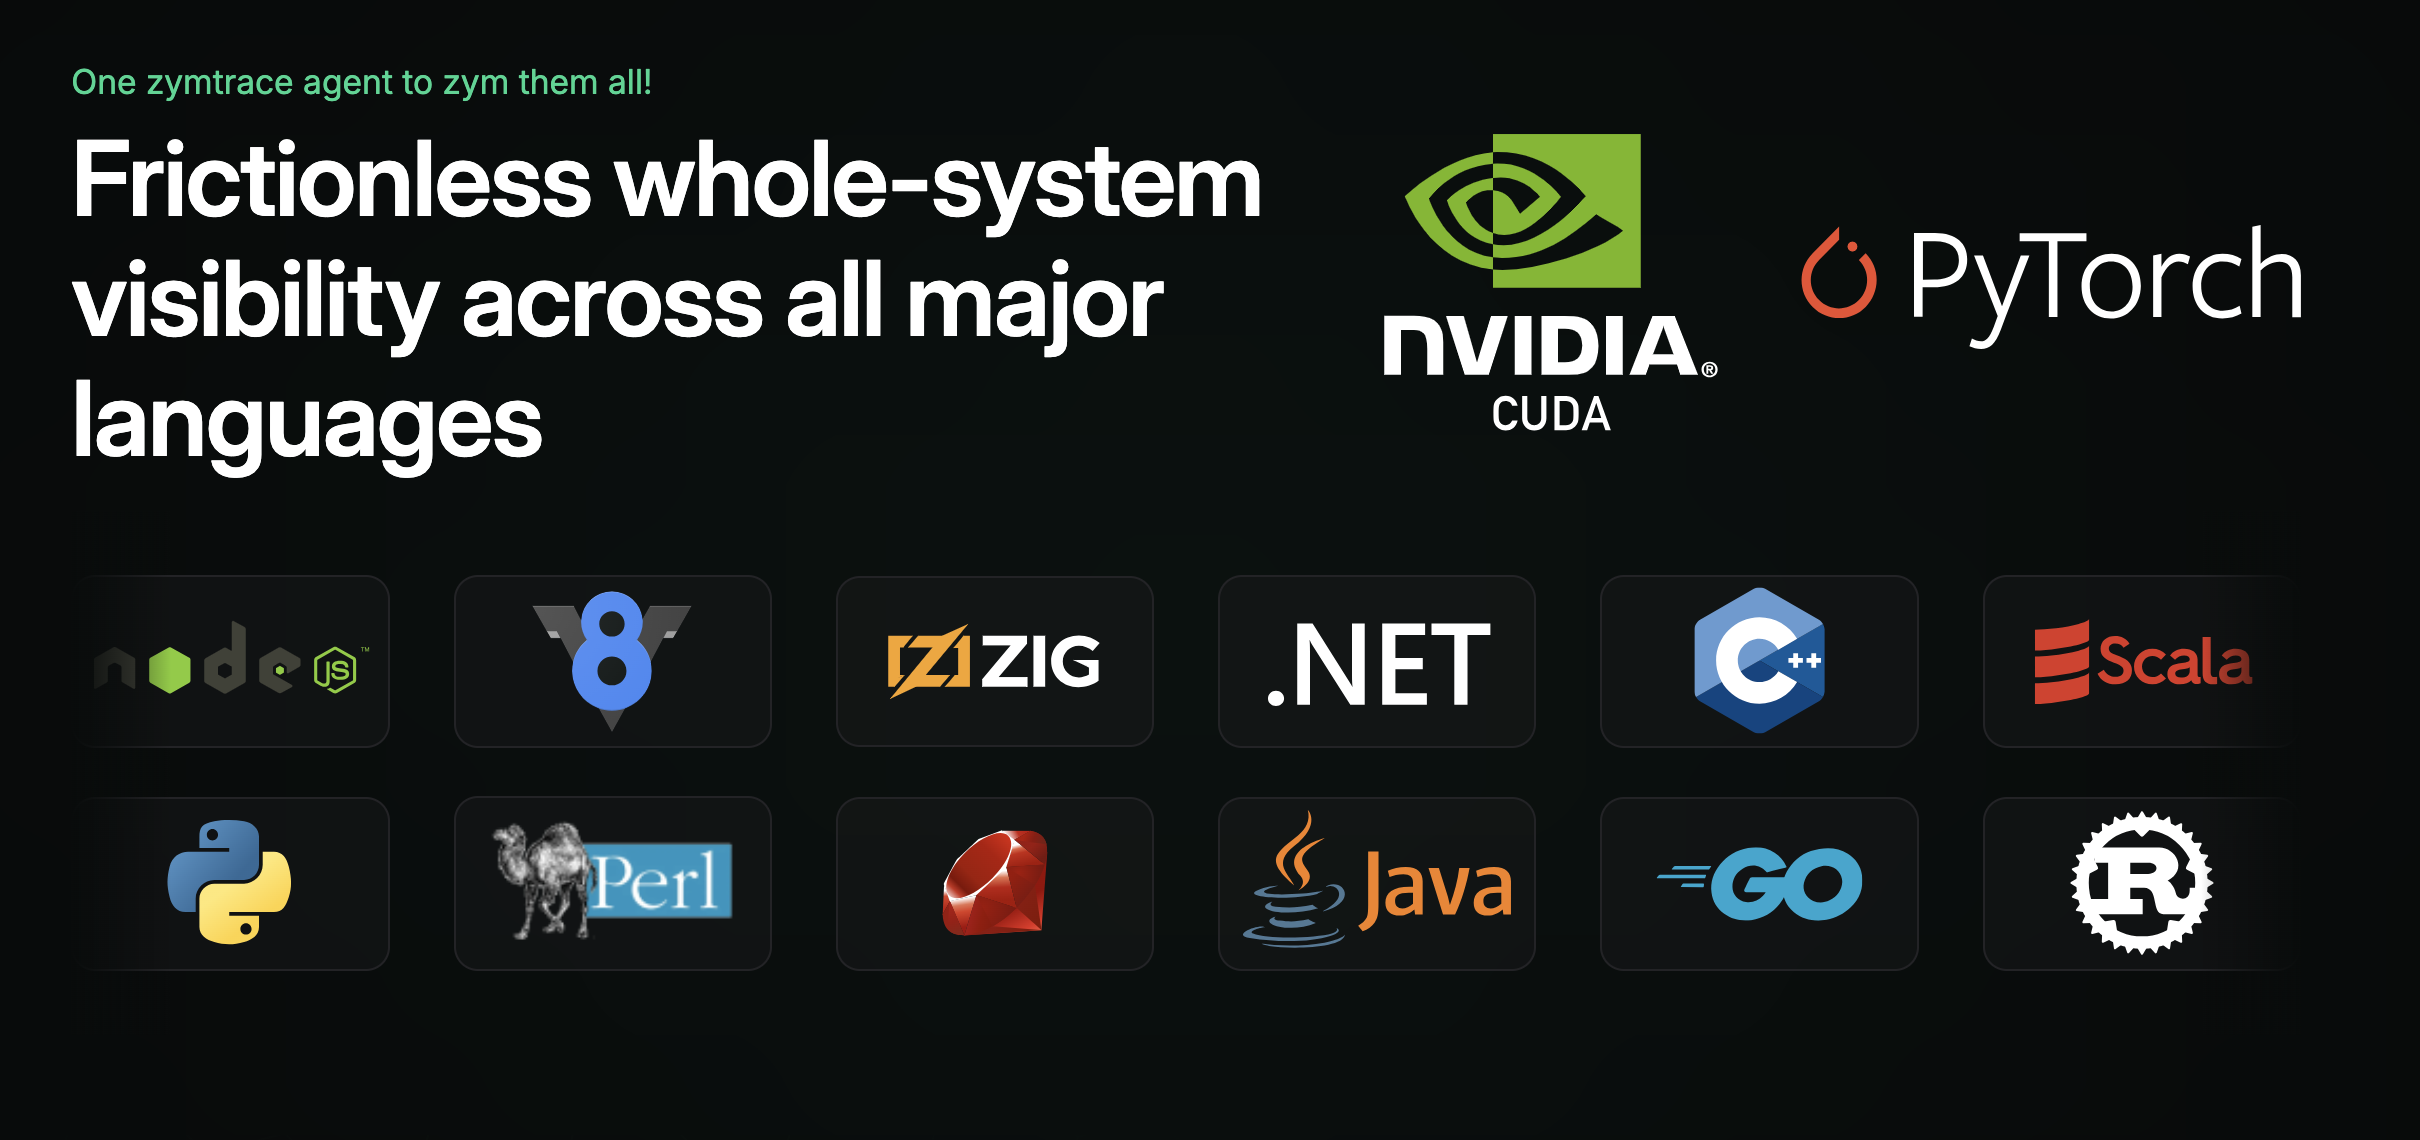
  • Programming Languages: Supports a wide range of programming languages, including PHP, Python, Java (or any JVM language), Go, Rust, C/C++, Node.js/V8, Ruby, .Net, and Perl.
  • Cloud Providers: Integrates with major cloud providers (AWS, Azure, GCP).
  • Container and Kubernetes Environments: Seamlessly works with containerized and Kubernetes environments.

Landing page

Core Capabilities

Zero Friction Deploy

  • Seamless Integration: No code changes or recompilation required.
  • Minimal Overhead: Negligible performance impact on your applications.
  • Broad Compatibility: Supports x86 and ARM64 architectures.
  • Open Standards: Adheres to OpenTelemetry for seamless integration with other observability signal types.

GPU/AI Profiling

  • In-Depth GPU Analysis: Gain detailed insights into NVIDIA CUDA workload execution, kernel launch and execution metrics, GPU memory utilization patterns, and hardware queue utilization.
  • PyTorch Model Optimization: Monitor PyTorch model execution, identify performance bottlenecks, and optimize model deployment.

CPU-GPU Interaction Analysis

  • End-to-End Visibility: Track the complete CPU code path, including memory transfers, system calls, I/O operations, and thread scheduling.
  • Data Movement Efficiency: Analyze the efficiency of data movement between CPU and GPU to identify potential bottlenecks.

Curated Insights

  • Automated Bottleneck Detection: Automatically identify performance bottlenecks and prioritize optimization efforts.
  • Actionable Recommendations: Receive tailored recommendations for improving performance, such as tuning hyperparameters, optimizing code, or adjusting hardware configurations.
  • Resource Utilization Analysis: Gain insights into resource utilization patterns to optimize hardware resource allocation.
  • Cost Impact Analysis: Assess the cost impact of different optimization strategies.

Cost and Efficiency Analysis

  • Workload Economics: Easily identify and optimize resource-intensive functions to reduce cloud costs.
  • Power Efficiency Monitoring: Monitor power consumption to optimize energy efficiency.
  • Sustainability Impact Reporting: Measure the environmental impact of your AI workloads.