Quick Start
Deploy in minutes. No code changes. zymtrace immediately shows you what is hurting performance across GPU and CPU workloads, down to the exact function, kernel, and stall reason — with AI-powered fixes and MCP access from your IDE.
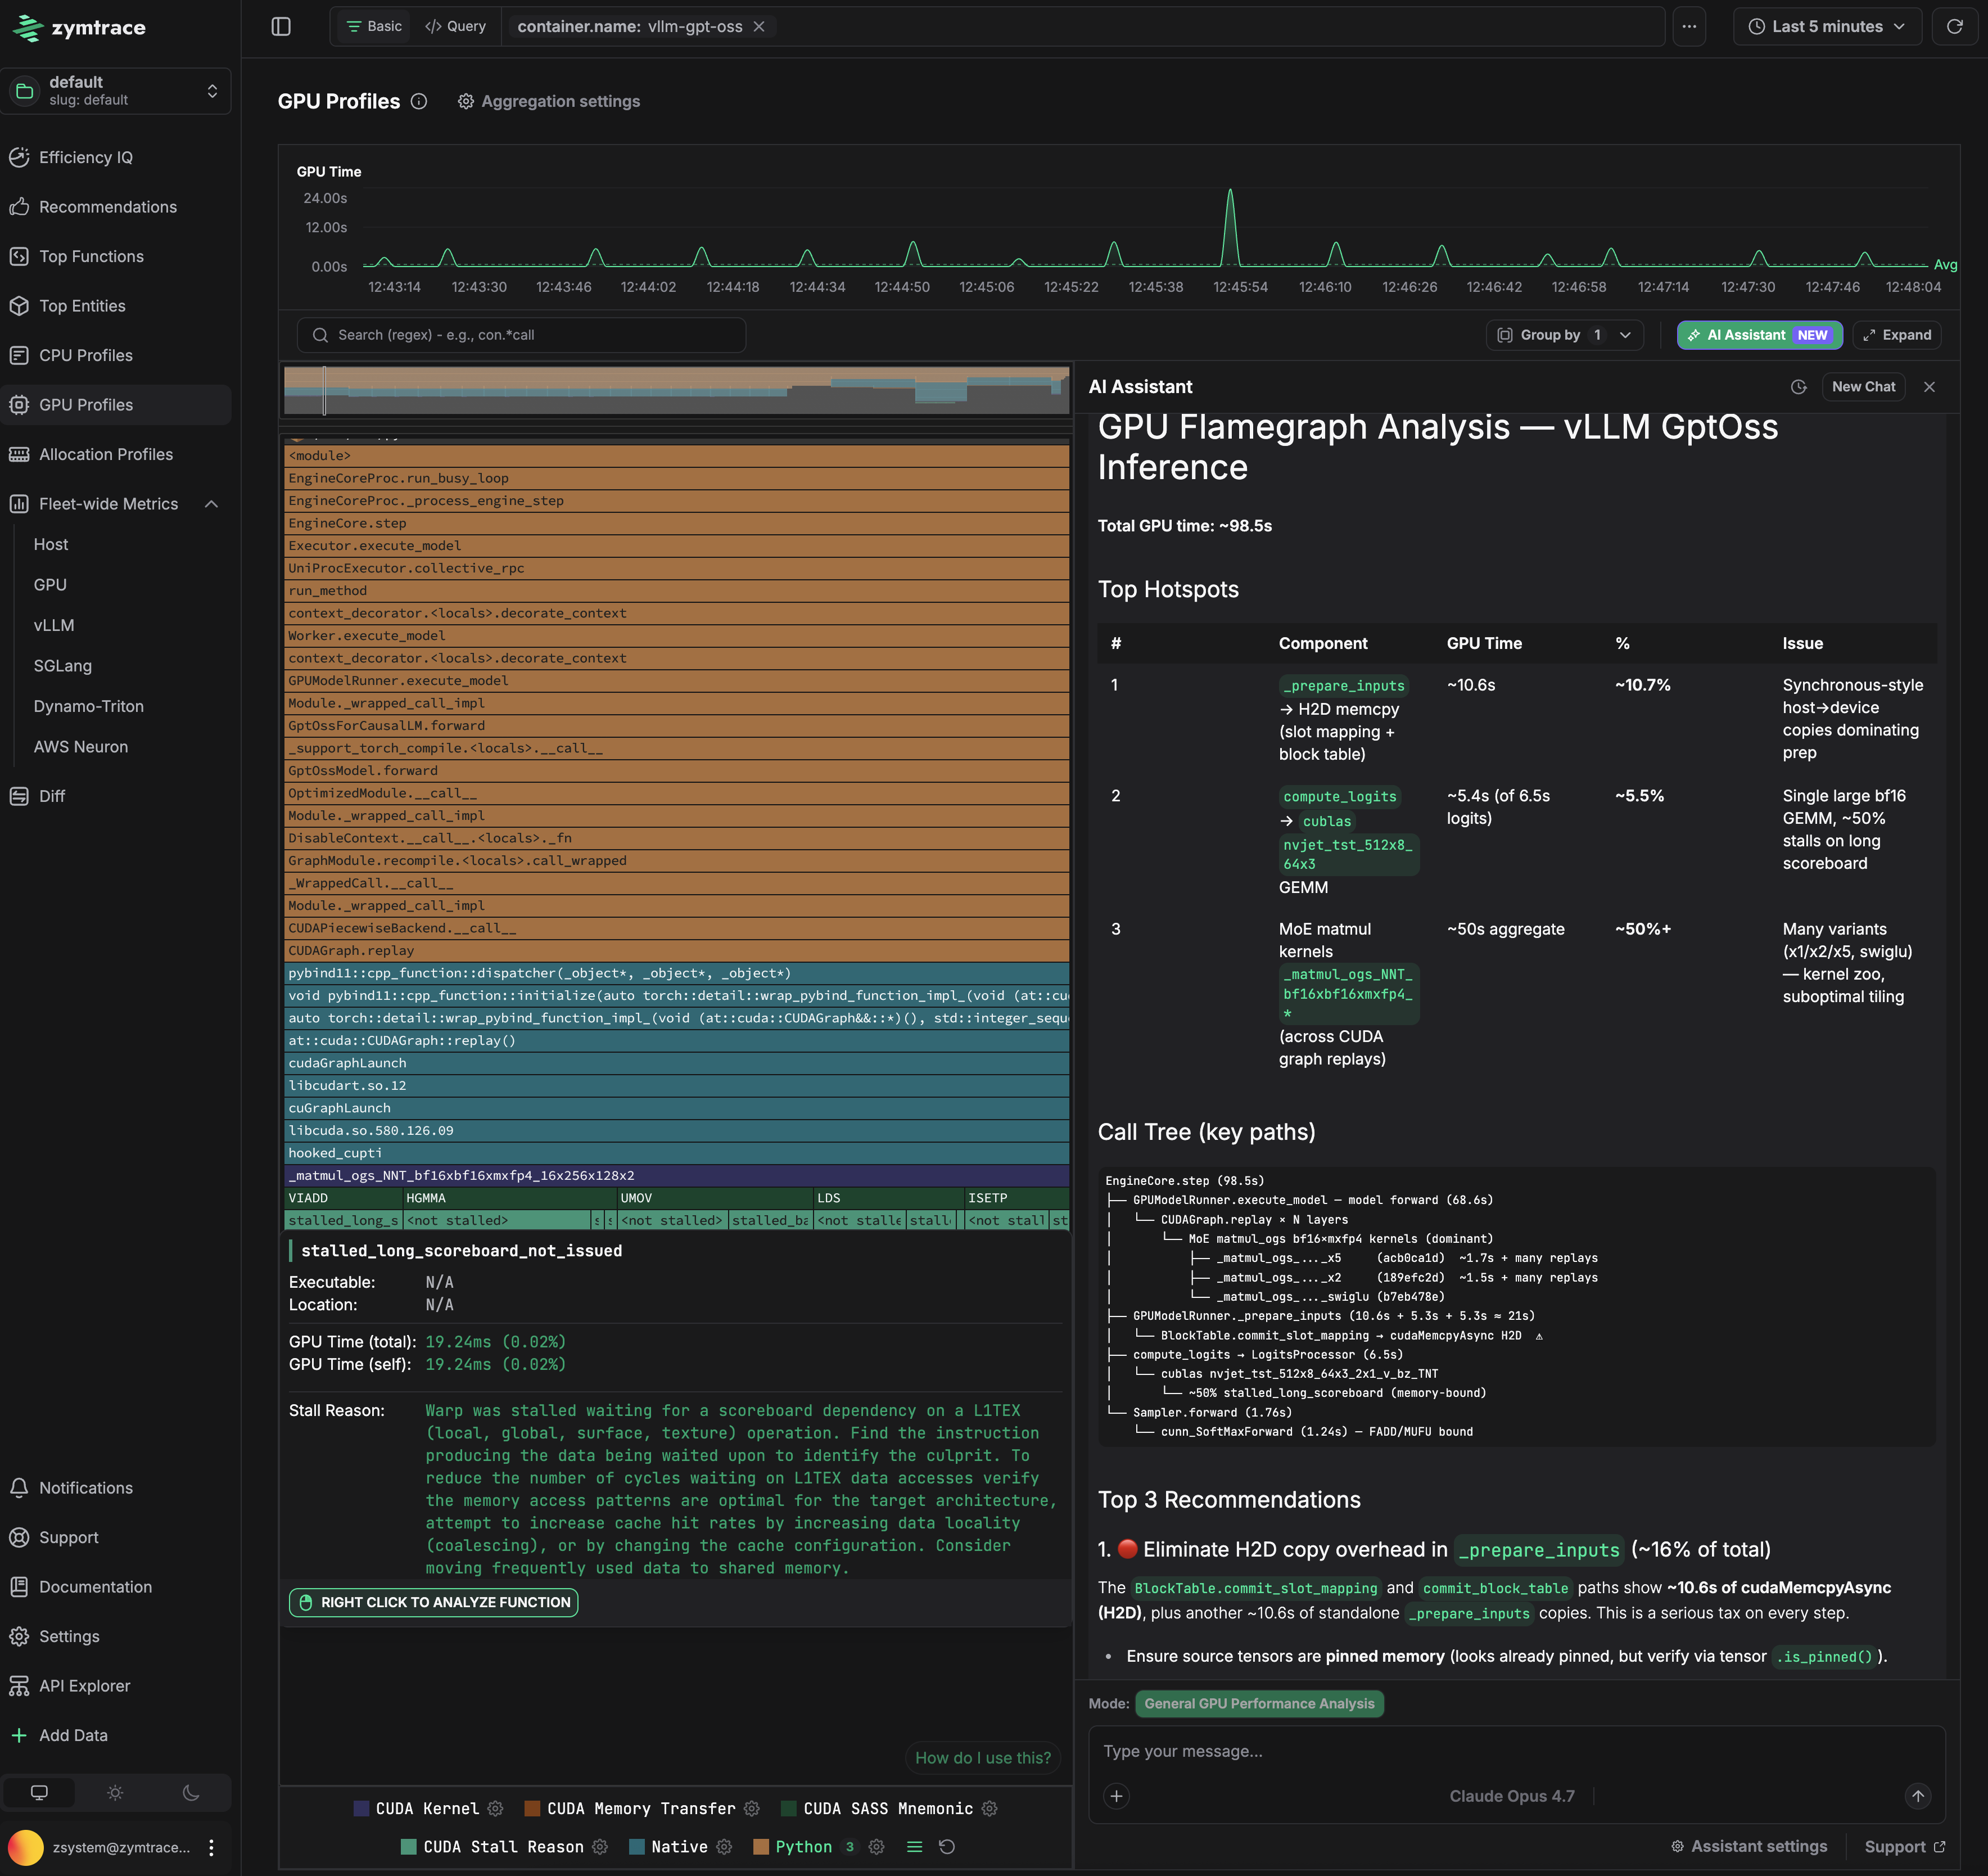
This is a GPT-OSS inference run on vLLM. The flamegraph on the left shows the full call path from Python down to CUDA kernels. The AI assistant on the right identified that hal.matmul is consuming ~50% of GPU time due to suboptimal kernel tiling, and that _prepare_inputs is stalling the GPU with synchronous host-to-device copies on every forward pass. Exact fixes for both are surfaced automatically.
There's a good chance you could unlock more value from zymtrace, and do it faster by having a quick chat with us about your use cases. We're a team of technical founders, not your typical pushy salespeople, and there's probably a thing or two we can learn from each other.
Reach out to us here and we’ll set you up with an advanced trial licence.
You're also welcome to continue with the self-guided trial below.
Get Started in Just 3 Simple Steps!
zymtrace is shipped with a free perpetual trial license — use it at no cost.
- Kubernetes (Helm)
- Docker Compose
Step 1: Add the zymtrace Helm repository
The Helm chart source code is available on GitHub: zystem-io/zymtrace-charts
To get started, add the zymtrace Helm repository by running the following command:
helm repo add zymtrace https://helm.zystem.io
To verify and list available charts and versions, use:
helm search repo zymtrace --versions
Step 2: Install the backend components
Deploy the backend components using Helm:
helm upgrade --install backend zymtrace/backend \
  --namespace zymtrace \
  --create-namespace \
  --reset-then-reuse-values \
  --debug \
  --atomic
Step 3: Install the profiler as a DaemonSet
The collection-agent arg should point to the gateway service or ingress, if you exposed it.
Deploy the profiler as a DaemonSet using the following command:
GPU Profiling enabled:
helm install profiler zymtrace/profiler \
  --namespace zymtrace \
  --create-namespace \
  --set profiler.cudaProfiler.enabled=true \
  --set profiler.args[0]="--collection-agent=zymtrace-gateway.zymtrace.svc.cluster.local:80" \
  --set profiler.args[1]="--disable-tls" \
  --set profiler.args[2]="--enable-gpu-metrics" \
  --set profiler.args[3]="--nvml-auto-scan"
Note: Use
--nvml-path=/path/to/libnvidia-ml.soinstead of--nvml-auto-scanif you know the exact NVML library path.
For a step-by-step guide to GPU profiling with Binary, Docker, or Kubernetes, see the GPU Profiler Quick Start. For advanced configuration, see Profiling CUDA Applications.
For CPU Profiling only:
helm install profiler zymtrace/profiler \
  --namespace zymtrace \
  --create-namespace \
  --debug \
  --set profiler.args[0]="--collection-agent=zymtrace-gateway.zymtrace.svc.cluster.local:80" \
  --set profiler.args[1]="--disable-tls"
We also have arm64 and x86/amd64 binary distributions of the zymtrace profiler.
Step 1: Create directory and download Docker Compose file
Create a project directory and download the zymtrace Docker Compose configuration:
mkdir zymtrace && cd zymtrace
curl -LO https://dl.zystem.io/zymtrace/26.6.1/noarch/docker-compose.yml
Step 2: Start the backend services
Launch all backend services with Docker Compose:
docker compose up -d --remove-orphans
This will start:
- ClickHouse database
- PostgreSQL database
- MinIO object storage
- zymtrace backend services (gateway, ingest, symdb, identity, ui)
If you're using a licensed version, create a .env file with your license key. This is not required for the free trial version.
echo 'ZYMTRACE_LICENSE_KEY="paste-key-here"' > .env
Replace paste-key-here with your actual license key.
Step 3: Access the UI
Navigate to http://localhost:8080 to access the zymtrace interface.
For profiler installation with Docker, refer to the profiler installation guide.
Start Using zymtrace: Efficiency IQ
Once deployed, access the Efficiency IQ page for a high-level overview of your fleet's performance. From this view, you can quickly spot performance spikes and identify emerging usage patterns, allowing you to optimize your system effectively. You can also navigate to flamegraphs and functions page from the Efficiency IQ dashboard.
You're all set!
📐 Architecture
Learn about zymtrace's architecture and components
✨ Install zymtrace Backend
Deploy zymtrace backend
⚡ Install zymtrace Profiler
Install zymtrace agent with Helm, Kubernetes manifests, Docker...