Platform Architecture
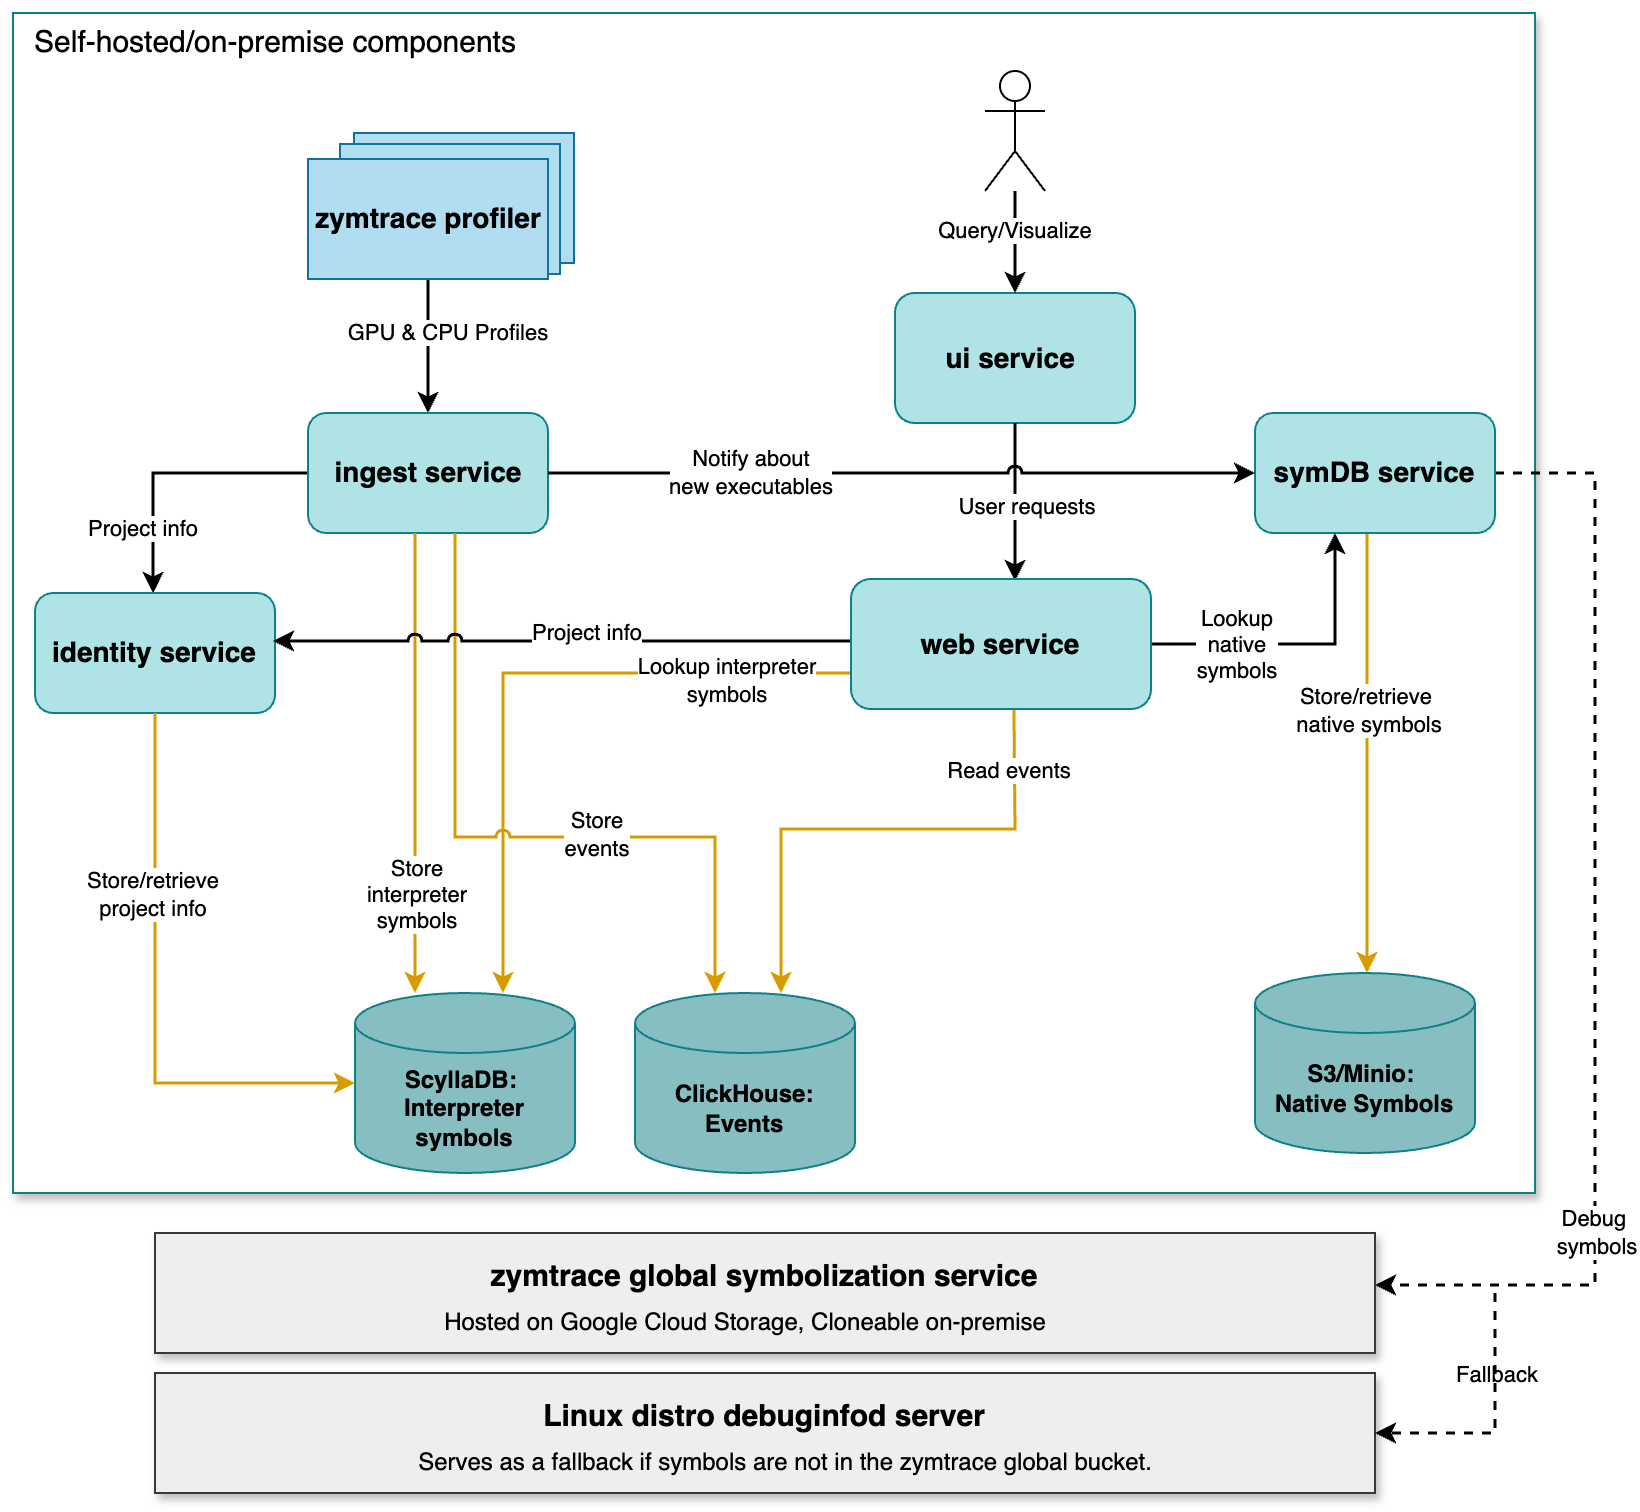
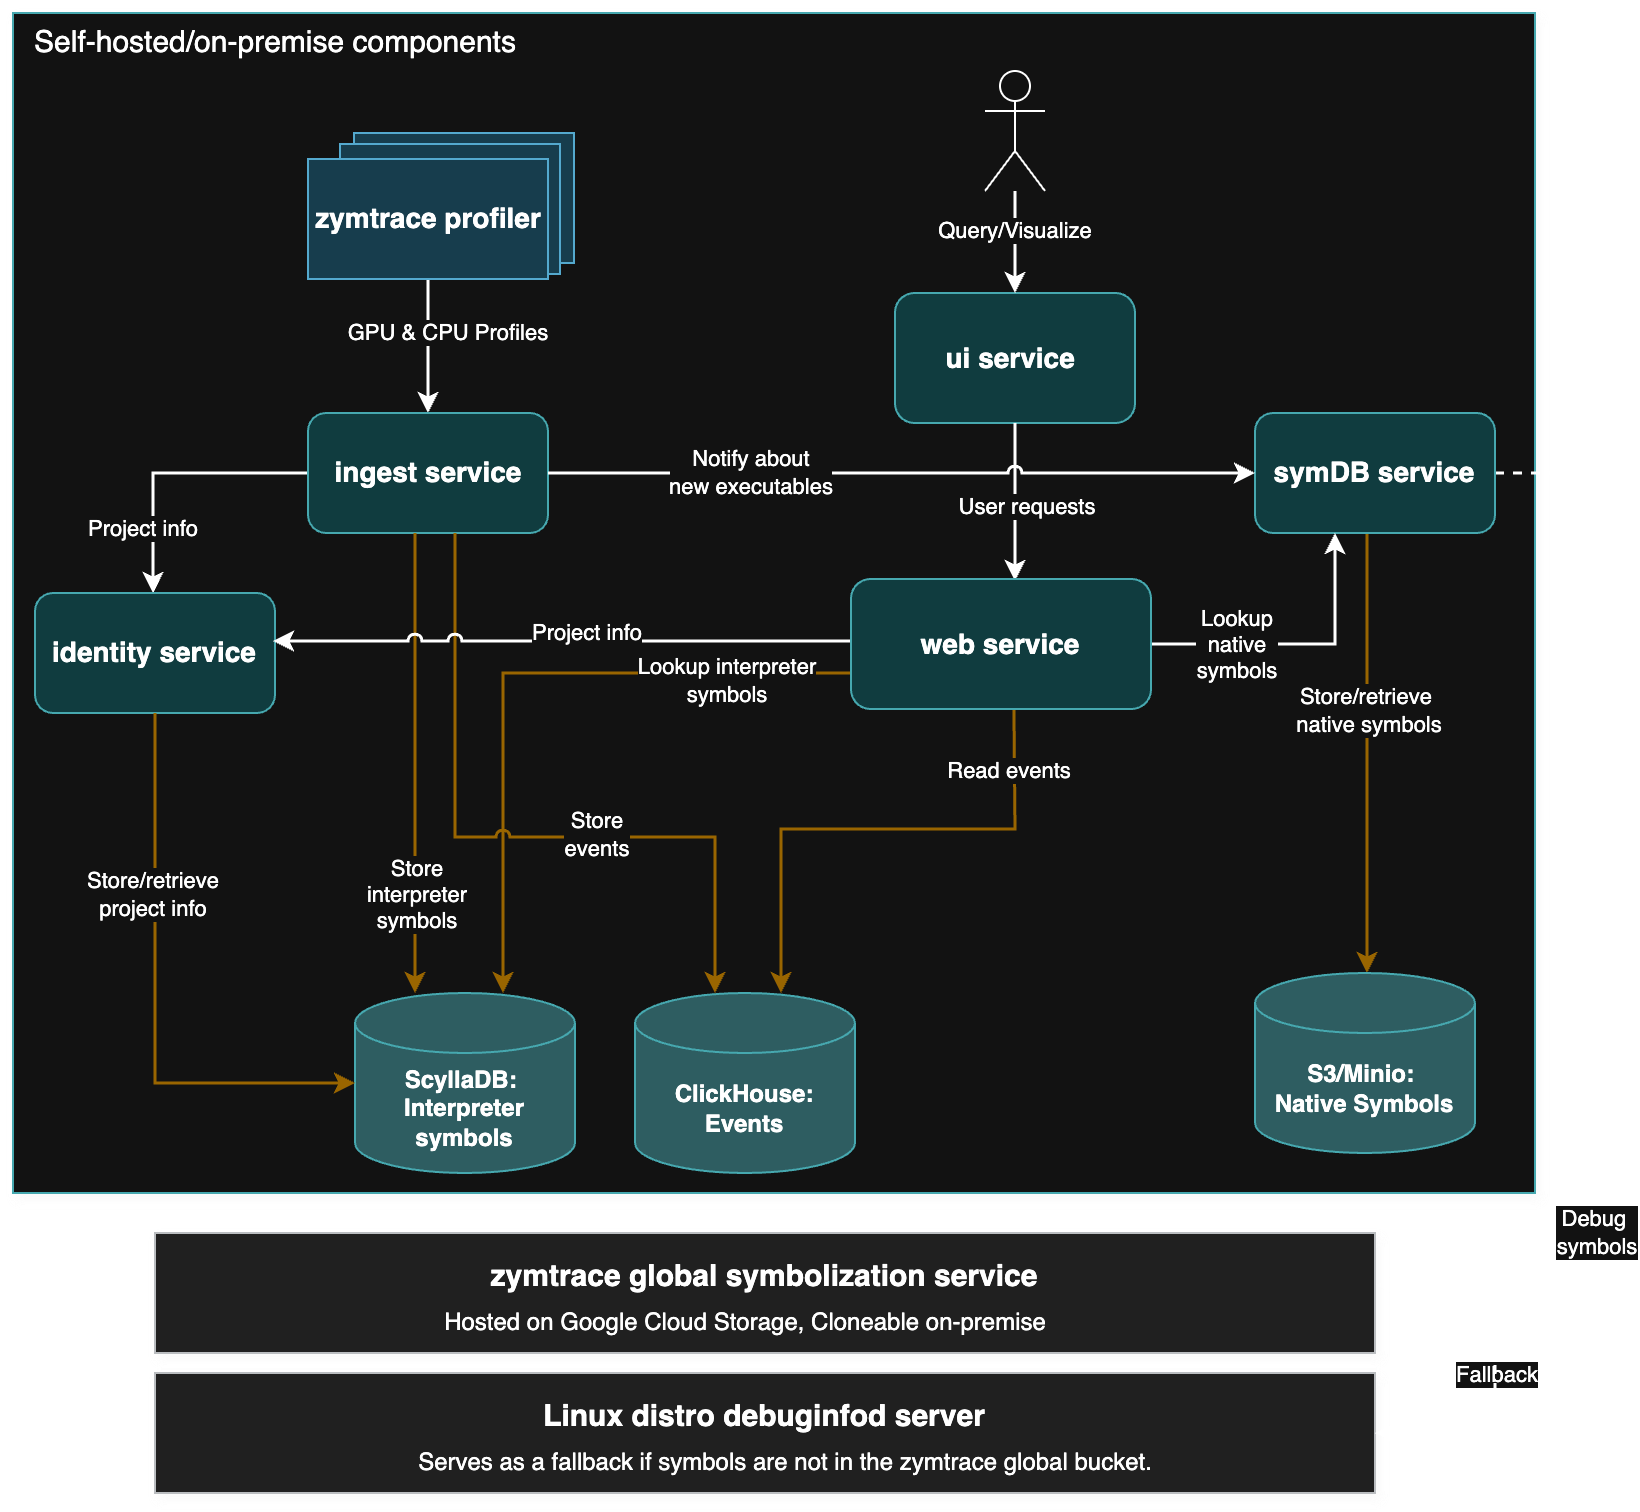
The zymtrace platform is only available for on-premises/self-hosted installation, allowing you to host and manage zymtrace entirely within your infrastructure for full control over your data and setup. The platform consists of two main components:
-
zymtrace profiler: An eBPF-based agent installed on each machine running your applications. It collects CPU and GPU performance profiles, and host metrics, all via eBPF — polling
/procis expensive due to repeated filesystem reads. Data is sent to the backend using the custom stateful protocol designed for the high throughput demands of fleet-wide profiling, or the stateless OTel Profiles protocol. Learn more →. -
Backend services: The backend services store, process, and analyze performance profiles and metrics. All our core backend services are written in Rust 🦀. The front-end is a combination of ReactJS and WASM. All data is also accessible via a REST API and MCP, directly from your zymtrace instance.
The diagram below depicts a high-level architecture of the components:
Need a hosted zymtrace backend?
We can provision a dedicated cloud deployment for you. Email us at [email protected] or request access here
Components overview
zymtrace profiler
The zymtrace profiler runs on each node, deployed either as a Kubernetes DaemonSet or as a standalone binary on a standard VM. It collects performance profiles of resource-intensive processes on the node, aggregates and compresses them, and sends them to the backend via gRPC. TLS is supported by default, with an option to disable it if needed.
Here's a more detailed description of how the profiler works:
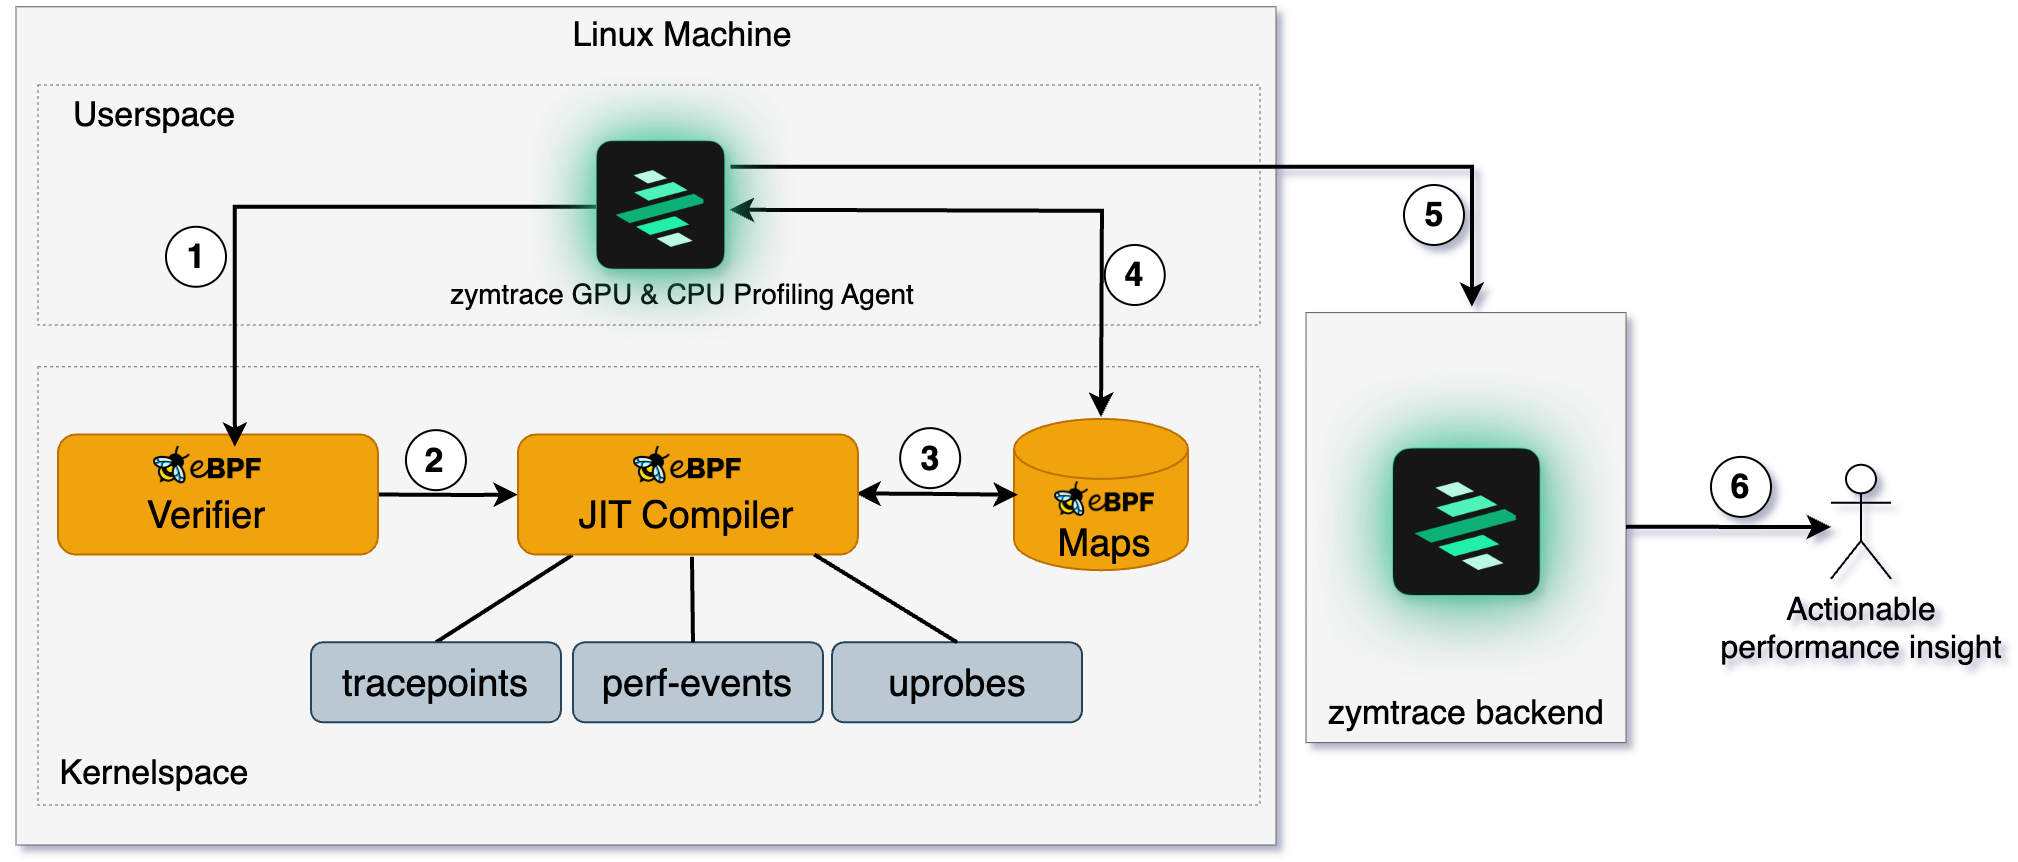
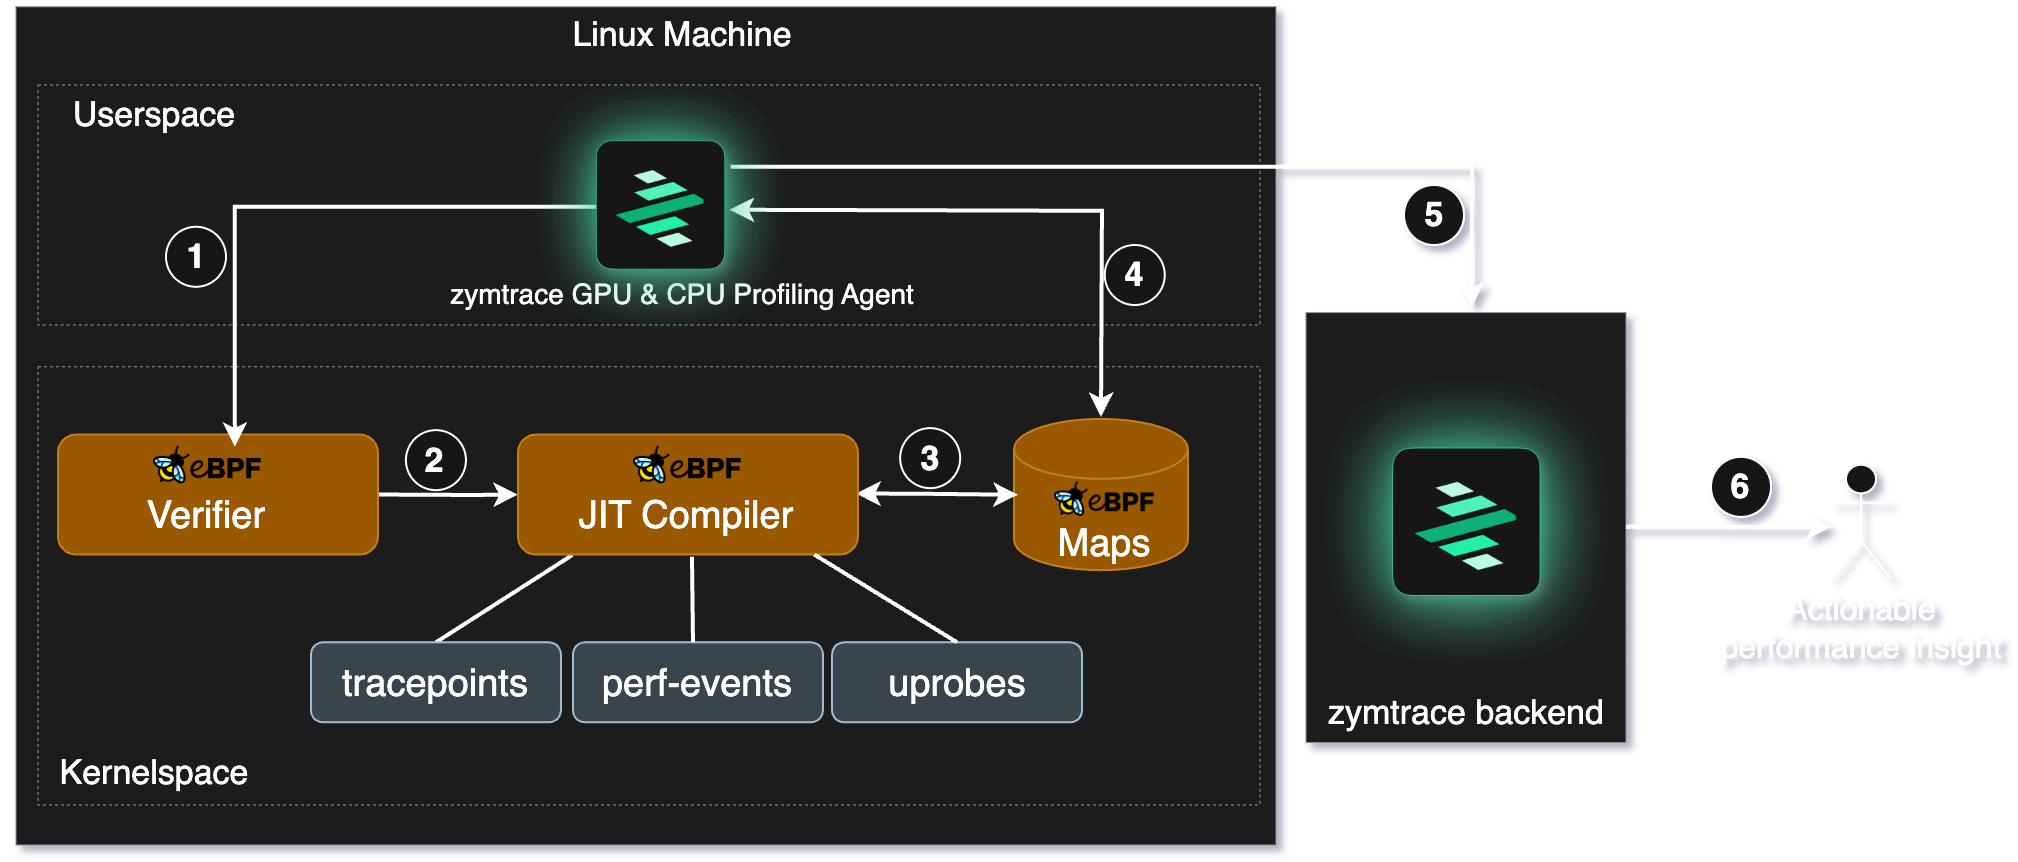
- Unwinder eBPF programs are loaded into the kernel.
- The kernel verifies the safety of the BPF program. If approved, the program is attached to probes and triggered upon specific events.
- The eBPF programs collect data and pass it to userspace via maps.
- The agent retrieves the collected data from maps. This data includes process-specific and interpreter-specific meta-information, which helps the eBPF unwinder programs perform mixed-stack unwinding across different languages (e.g., Python calling into C libraries).
- The agent pushes stack traces, metrics, and metadata to the zymtrace gateway service for routing to the appropriate backend services for analysis.
- Easily identify & optimize the most inefficient functions across your entire infrastructure.
zymtrace GPU profiler
GPU utilization, temperature, power: those metrics are easy to collect, but they don't explain the inner workings of the GPU or why it is idling. That's why we didn't start with NVML or DCGM metrics. We started deeper, closer to the hardware. That's where real insight lives, not just in metrics.
zymtrace profiles down to CUDA kernels, disassembles CUDA SASS mnemonics, exposes GPU stall reasons, and correlates it all back to the CPU traces that launched the kernels, without requiring recompilation.
Support for additional accelerators is actively in progress, including AWS Neuron (Inferentia/Trainium), AMD ROCm, and TPUs.
Learn more: GPU Profiler deep dive →
zymtrace backend services
The zymtrace backend is designed to store, process and visualize profiling data efficiently. Below is an overview of the key backend services and their roles:
gateway service
The gateway service acts as the main entry point for all user requests, using Envoy Proxy for request routing and load balancing. It routes requests to the appropriate backend services (UI, ingest, symDB) and handles mTLS when configured.
UI service
The UI service serves the web-based user interface for zymtrace, built with ReactJS and WASM. Users access the UI through the gateway service, which routes web requests to this service.
ingest service
The ingest service receives profiling data and metrics from the zymtrace profiler via the gateway service, and stores them in ClickHouse for ultra-fast querying and analysis.
In addition to CPU and GPU profiling data, the ingest service handles metrics from:
- GPU performance metrics: utilization, memory, temperature, SM efficiency, SM occupancy, Tensor Core utilization, PCIe throughput
- AWS Neuron: metrics from Inferentia and Trainium accelerators
- NVIDIA Dynamo / Triton: inference server metrics
- vLLM: LLM serving metrics
- SGLang: structured generation serving metrics
- Host metrics: CPU, memory, disk throughput and latency, collected via eBPF rather than polling
/proc— polling/procis expensive due to repeated filesystem reads
Every metric data point is correlated to the underlying CPU and GPU profiles, so you can move directly from a metric anomaly to the exact code path responsible. Data is received over the wire protocol.
symDB service
The symDB service handles symbol resolution upon request. It retrieves native symbols stored in S3/Minio or fetches them from the global symbolization service. This service is critical for converting raw profiling data into meaningful stack traces by resolving both native and interpreted symbols. Learn more: Symbolization deep dive →
identity service
zymtrace provides the granularity to segregate your profiling data into different projects within an organization. The identity service currently manages these projects. It associates incoming profiling data from the ingest service with the correct project, laying the foundation for future user authentication and role-based access control.
Wire protocol
By default, the profiler communicates with the backend using a custom stateful wire protocol that is 6x more compute-efficient than the OpenTelemetry Profiles proto. Because the protocol is stateful, the agent only transmits new information rather than re-sending context with every payload, which is what the stateless OTel proto requires. This keeps agent CPU overhead and network egress minimal at fleet scale.
You can switch between the custom zymtrace protocol and OTel Profiles protocol at any time without losing data. See Profiler ENV & CLI Args. The OTel Profiles specification recently reached alpha; the zymtrace founders were core contributors, part of the team that donated the profiler and helped define the spec inside the OpenTelemetry project.
zymtrace is fully OTel-compliant for resource attributes and metadata. All profiling data is tagged using OpenTelemetry resource attributes, usable directly in filters and queries.
To switch to the OTel Profiles protocol, set -zymtrace-protocol=false. See Profiler ENV & CLI Args for all configuration options.
Storage
| Storage | Purpose | |
|---|---|---|
| ClickHouse | Profiling events and analytics | Guide |
| PostgreSQL | User data, metadata, project configuration | Guide |
| S3 / MinIO | Native debug symbols | Guide |
MCP
zymtrace implements the Model Context Protocol, letting AI agents in your IDE query profiling data using natural language. Learn more →
claude mcp add zymtrace \
  --transport http \
  https://your-zymtrace-instance.com/mcp \
  --header "Authorization: Bearer YOUR_TOKEN_HERE"
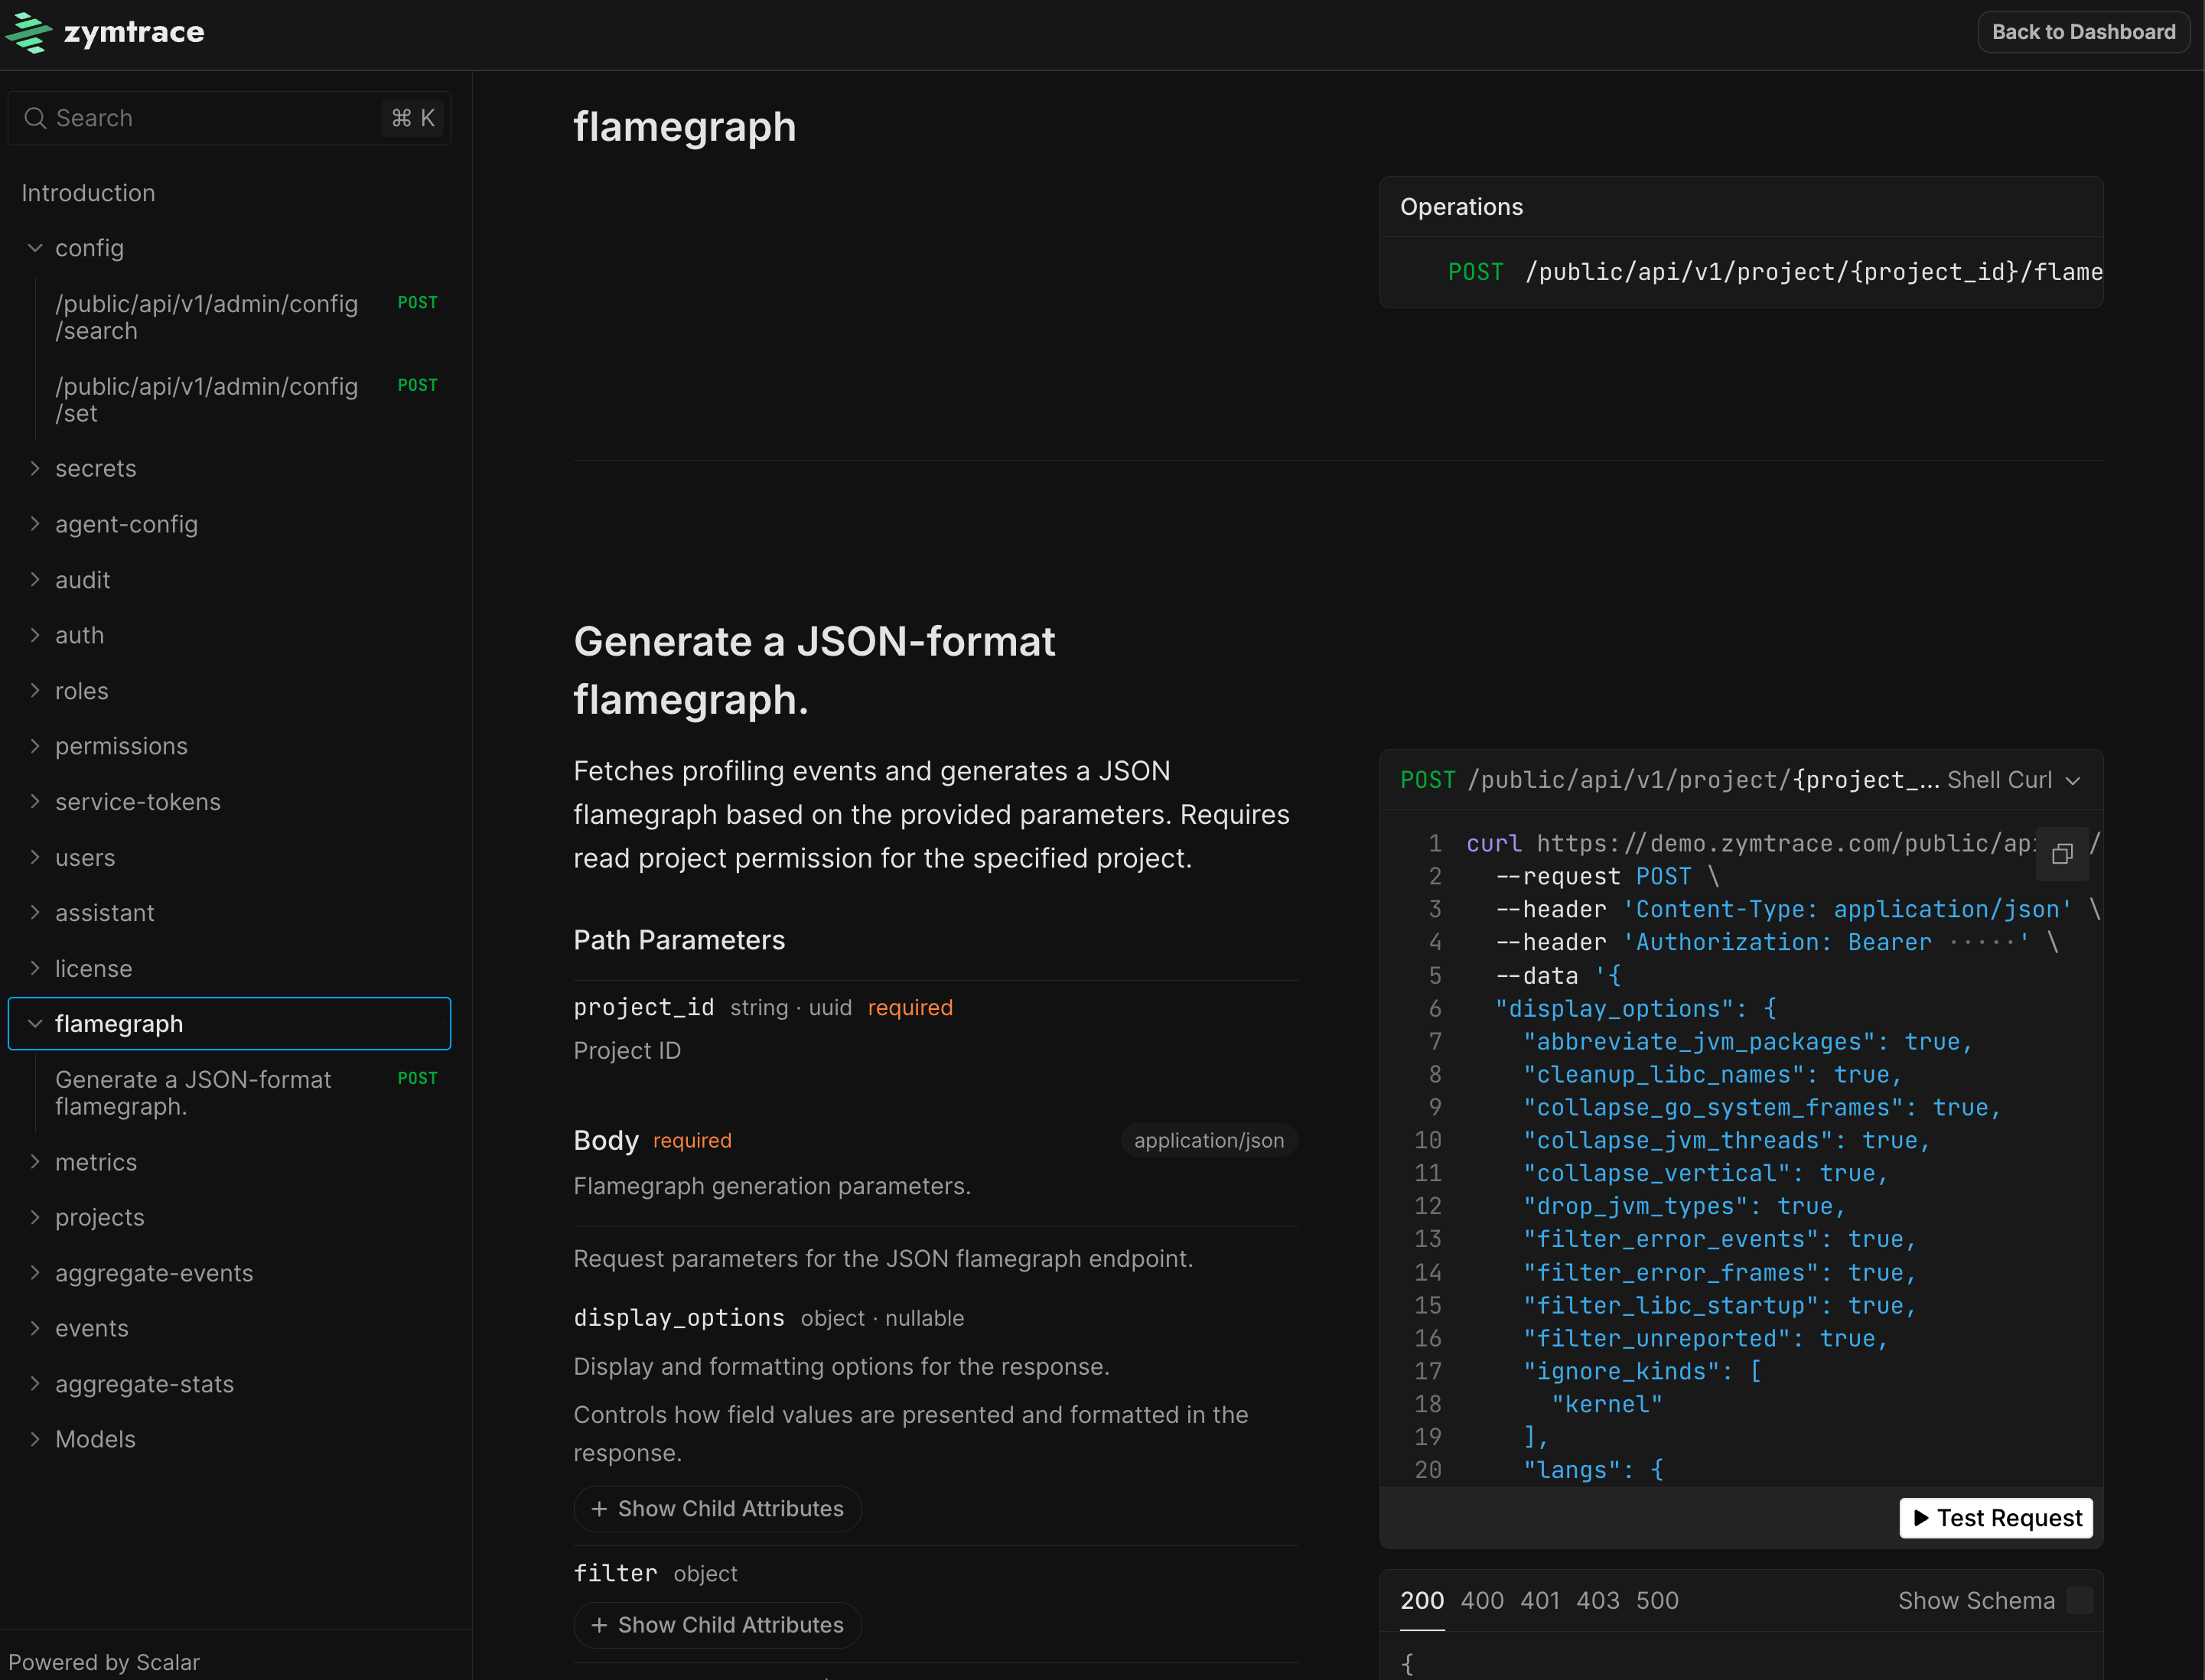
API
Every piece of data in zymtrace is accessible via a REST API. Click API Explorer inside your zymtrace instance to browse and test every endpoint interactively.
Get started
zymtrace backend (On-Premises)
Refer to our on-premises installation guide for detailed instructions.
zymtrace profiler
Refer to the profiler host agent installation guide for more details.