AI Assisted Profiling
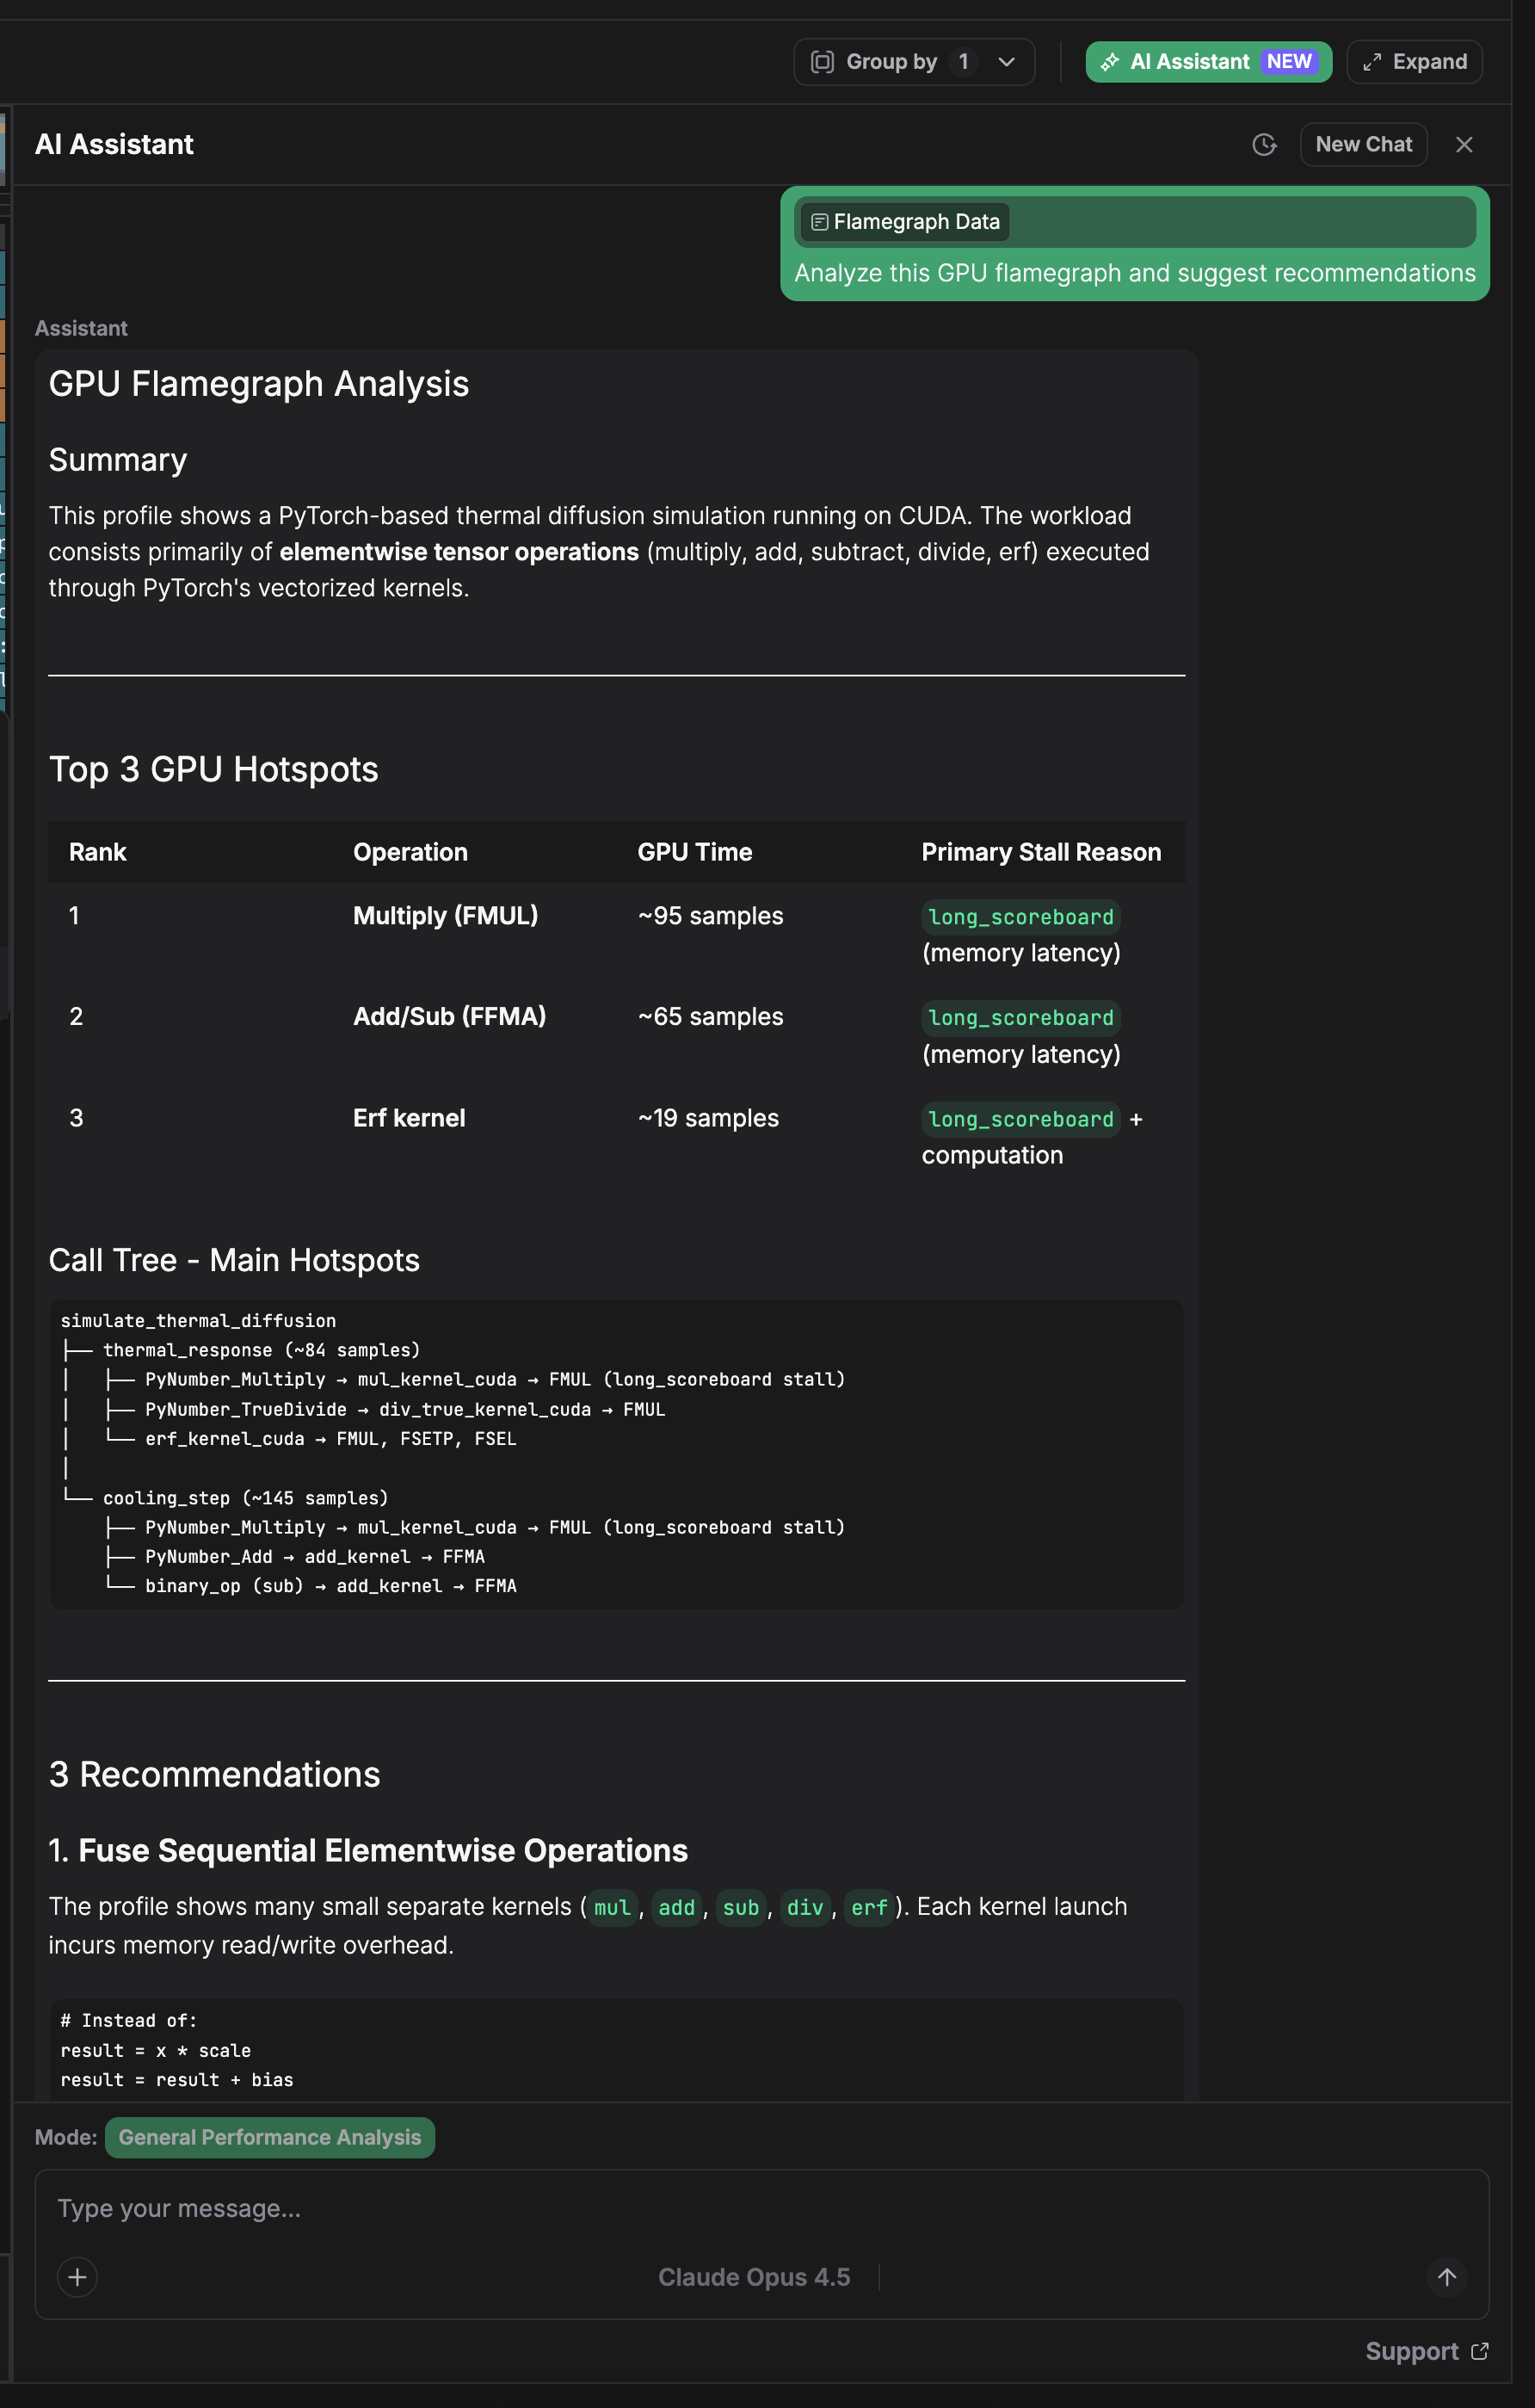
zymtrace provides context-aware AI analysis for your CPU and GPU profiling data. Ask questions in natural language, get actionable optimization recommendations, and turn complex flamegraphs into concrete performance improvements.
Reducing Mean Time to Dopamine
Flamegraphs are powerful but dense. Even experienced engineers can spend hours staring at call stacks before finding the optimization that matters. GPU profiles add another layer: CUDA kernels, tensor operations, memory transfers, and framework overhead all interleave in ways that require specialized knowledge to untangle.
This skill gap slows everyone down. Junior engineers struggle to know where to start. Senior engineers spend time on interpretation instead of implementation. And the dopamine hit of actually shipping a performance fix gets delayed by hours or days of analysis.
AI analysis compresses this loop. Describe what you're investigating, get targeted recommendations, and move straight to the fix. The goal isn't to replace profiling expertise—it's to make that expertise accessible faster, so more of your team can turn profiles into shipped improvements.
Context-Aware Analysis
Unlike generic AI assistants, zymtrace's AI integration understands your profiling context:
- Profile metadata: Hosts, Namespaces, Deployments, Pods, containers and main executables
- Flamegraph structure: Call stacks, resource attribution, and function-level timing
- GPU-specific patterns: CUDA kernel launches, memory copy operations, tensor core utilization
- Historical context: How current profiles compare to previous captures
This context enables precise answers. When you ask "why is inference slow?", the AI examines your actual profile data—not just general ML performance advice.
What You Can Do
-
Identify bottlenecks — Point to hotspots in your flamegraph and get explanations of why that code path is expensive, whether it's expected, and what alternatives exist.
-
Get optimization recommendations — Receive specific suggestions: batching strategies, memory layout changes, kernel fusion opportunities, or framework configuration tweaks.
-
Investigate regressions — Compare profiles across deployments and understand what changed. The AI highlights meaningful differences versus noise.
-
Learn as you go — Ask follow-up questions about GPU architecture, framework internals, or profiling methodology. Build intuition alongside getting answers.
Supported Providers
Configure your preferred AI provider:
- Anthropic Claude
- Google Gemini
- OpenAI GPT
- Custom inference endpoints
Flexible Inference Options
zymtrace supports both cloud-hosted and self-hosted AI inferences, giving you complete control over your AI infrastructure:
Cloud Providers: Use managed AI services from Anthropic, Google, or OpenAI for immediate setup and global scale.
Self-Hosted/Custom: Deploy your own models or use specialized providers like Groq, Together AI, or any OpenAI-compatible endpoint. Perfect for:
- Enterprise data governance and compliance
- Custom fine-tuned models for domain-specific analysis
- Cost optimization with specialized hardware
- Air-gapped or restricted environments
You bring your own API key. Your profiling data is sent to the AI provider only when you explicitly request analysis. zymtrace doesn't share profile data with third parties by default.
If you'd like AI-powered profiling analysis directly in your development environment, check out MCP integration. Connect zymtrace to Claude Desktop, Cursor, Cody, or any MCP-compatible client.