zymtrace GPU Profiler Architecture
Overview
GPU utilization, temperature, power—those metrics are easy to collect, but they don't explain the inner workings of the GPU or why it is idling. That's why we didn't start with NVML or DCGM metrics. We started deeper, closer to the hardware.
zymtrace provides visibility down to CUDA kernels, disassembles CUDA SASS mnemonics, exposes GPU stall reasons, and correlates it all back to the CPU traces that launched the kernels, without requiring recompilation.
Correlating CPU stack traces to CUDA kernels is a key differentiator in our approach, because most GPU idle cycles happen when the GPU is waiting on the CPU to finish execution.
How the CUDA profiler works
The CUDA profiler is not a standalone component. It's a module within the zymtrace profiler, which can be enabled by simply setting a flag. It consists of libzymtracecudaprofiler.so, a library that is shipped with the zymtrace profiler. If enabled, the library is extracted into a specified directory upon startup and can be loaded into your CUDA workload via CUDA's CUDA_INJECTION64_PATH environment variable. Refer to the Kubernetes and Docker examples here.
The zymtrace CUDA profiler collects information about kernel launches and completions. The profiler also samples high-granularity information about precisely which GPU instructions (SASS) are running on the GPU's compute cores and the reasons for what is currently preventing the kernel from making progress (stall reasons). These stall reasons provide clear indications on why the kernel is slow. For example, there are stall reasons indicating that the GPU is waiting for a slow read from global memory or when it is waiting for an oversubscribed math pipeline. This information is pre-aggregated within the CUDA profiler and then sent out to zymtrace-profiler.
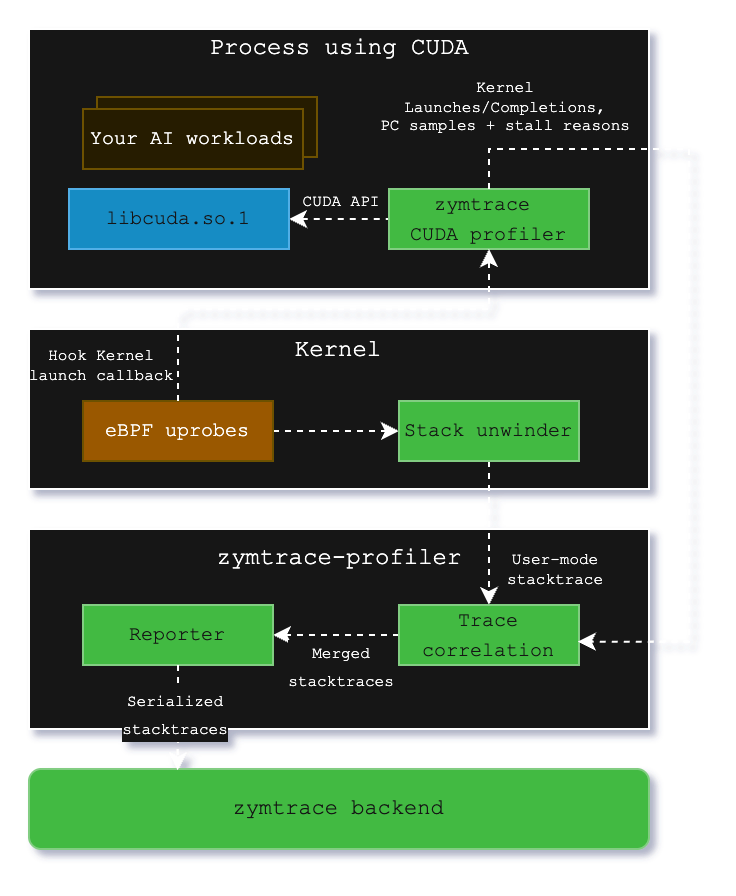
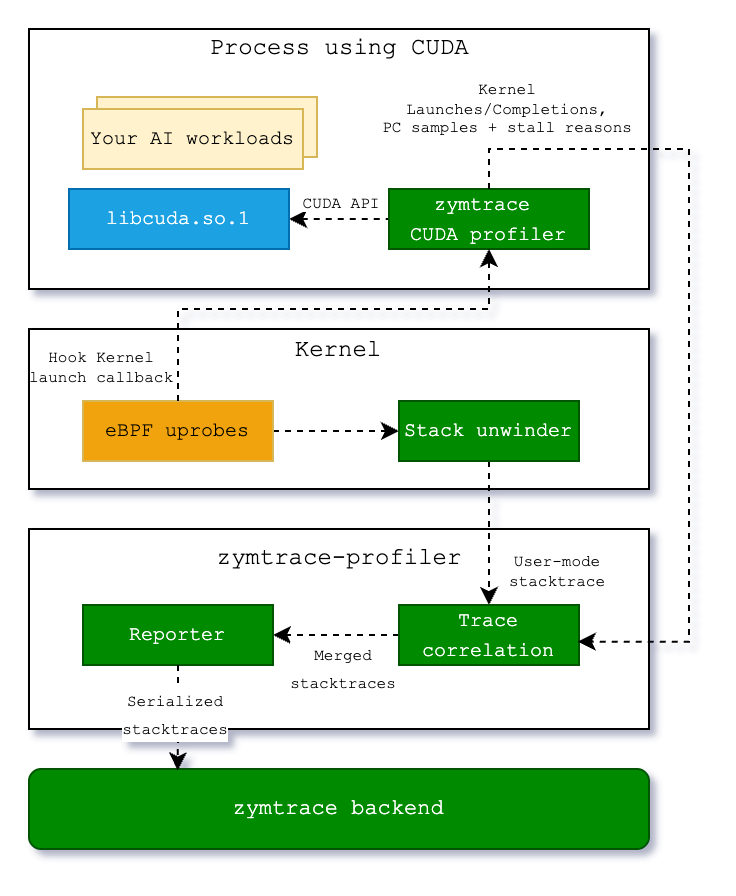
Within libzymtracecudaprofiler.so, we place callbacks on all CUDA functions that can launch a CUDA kernel. zymtrace profiler detects the CUDA profiler and places a uprobe on an exported function that is called each time that a kernel is launched. The uprobe, in turn, invokes the CPU stack unwinder that we're also using for CPU profiling in general. The BPF code additionally collects the necessary information about the kernel launch that is sent along with the stack trace to enable correlation with the data that is collected in the CUDA profiler library.
Once both the stack traces collected in BPF and the kernel launch/completion data arrive in zymtrace profiler, they are merged together and sent out as a single combined stack trace that spans from the user-mode code that enqueued the kernel into the CUDA kernel that got invoked on the GPU and, if enabled, the individual instructions and stall reasons.
These traces are then sent out to our backend, ready to be visualized as a flamegraph within our UI.
zymtrace AI flamegraph anatomy
The zymtrace AI flamegraph displays stack traces from the CPU code down to the CUDA instruction offset. Our flamegraph renderer was built from the ground up in Rust and WebAssembly (WASM).
Refer to our blog post "zymtrace AI Flamegraph: Why We Ditched TypeScript for Rust and WebAssembly" to learn more
The diagram below shows the general execution flow of the zymtrace AI flamegraph.
use-case: DeepSeek-R1-Distill-Qwen execution on vLLM
The AI flamegraph below captures a complete inference pass using the DeepSeek-R1-Distill-Qwen-1.5B model via vLLM, providing end-to-end visibility with zero friction.
The most revealing part is at the bottom of the flamegraph, which shows the actual GPU instruction execution breakdown. The execution is bottlenecked on ISETP (Integer Set Predicate) instructions, with additional time spent in BAR (warp synchronization barriers). The stall reason (smsp__pcsamp_warps_issue_stalled_long_scoreboard) at addresses 0x1710 and 0x1430 indicates memory-related stalls where GPU warps are waiting for data dependencies to resolve. Using this information, we are building recommendations that guide users on code changes (in the case of training) or vLLM fine-tuning (in this case) required to optimize this execution.
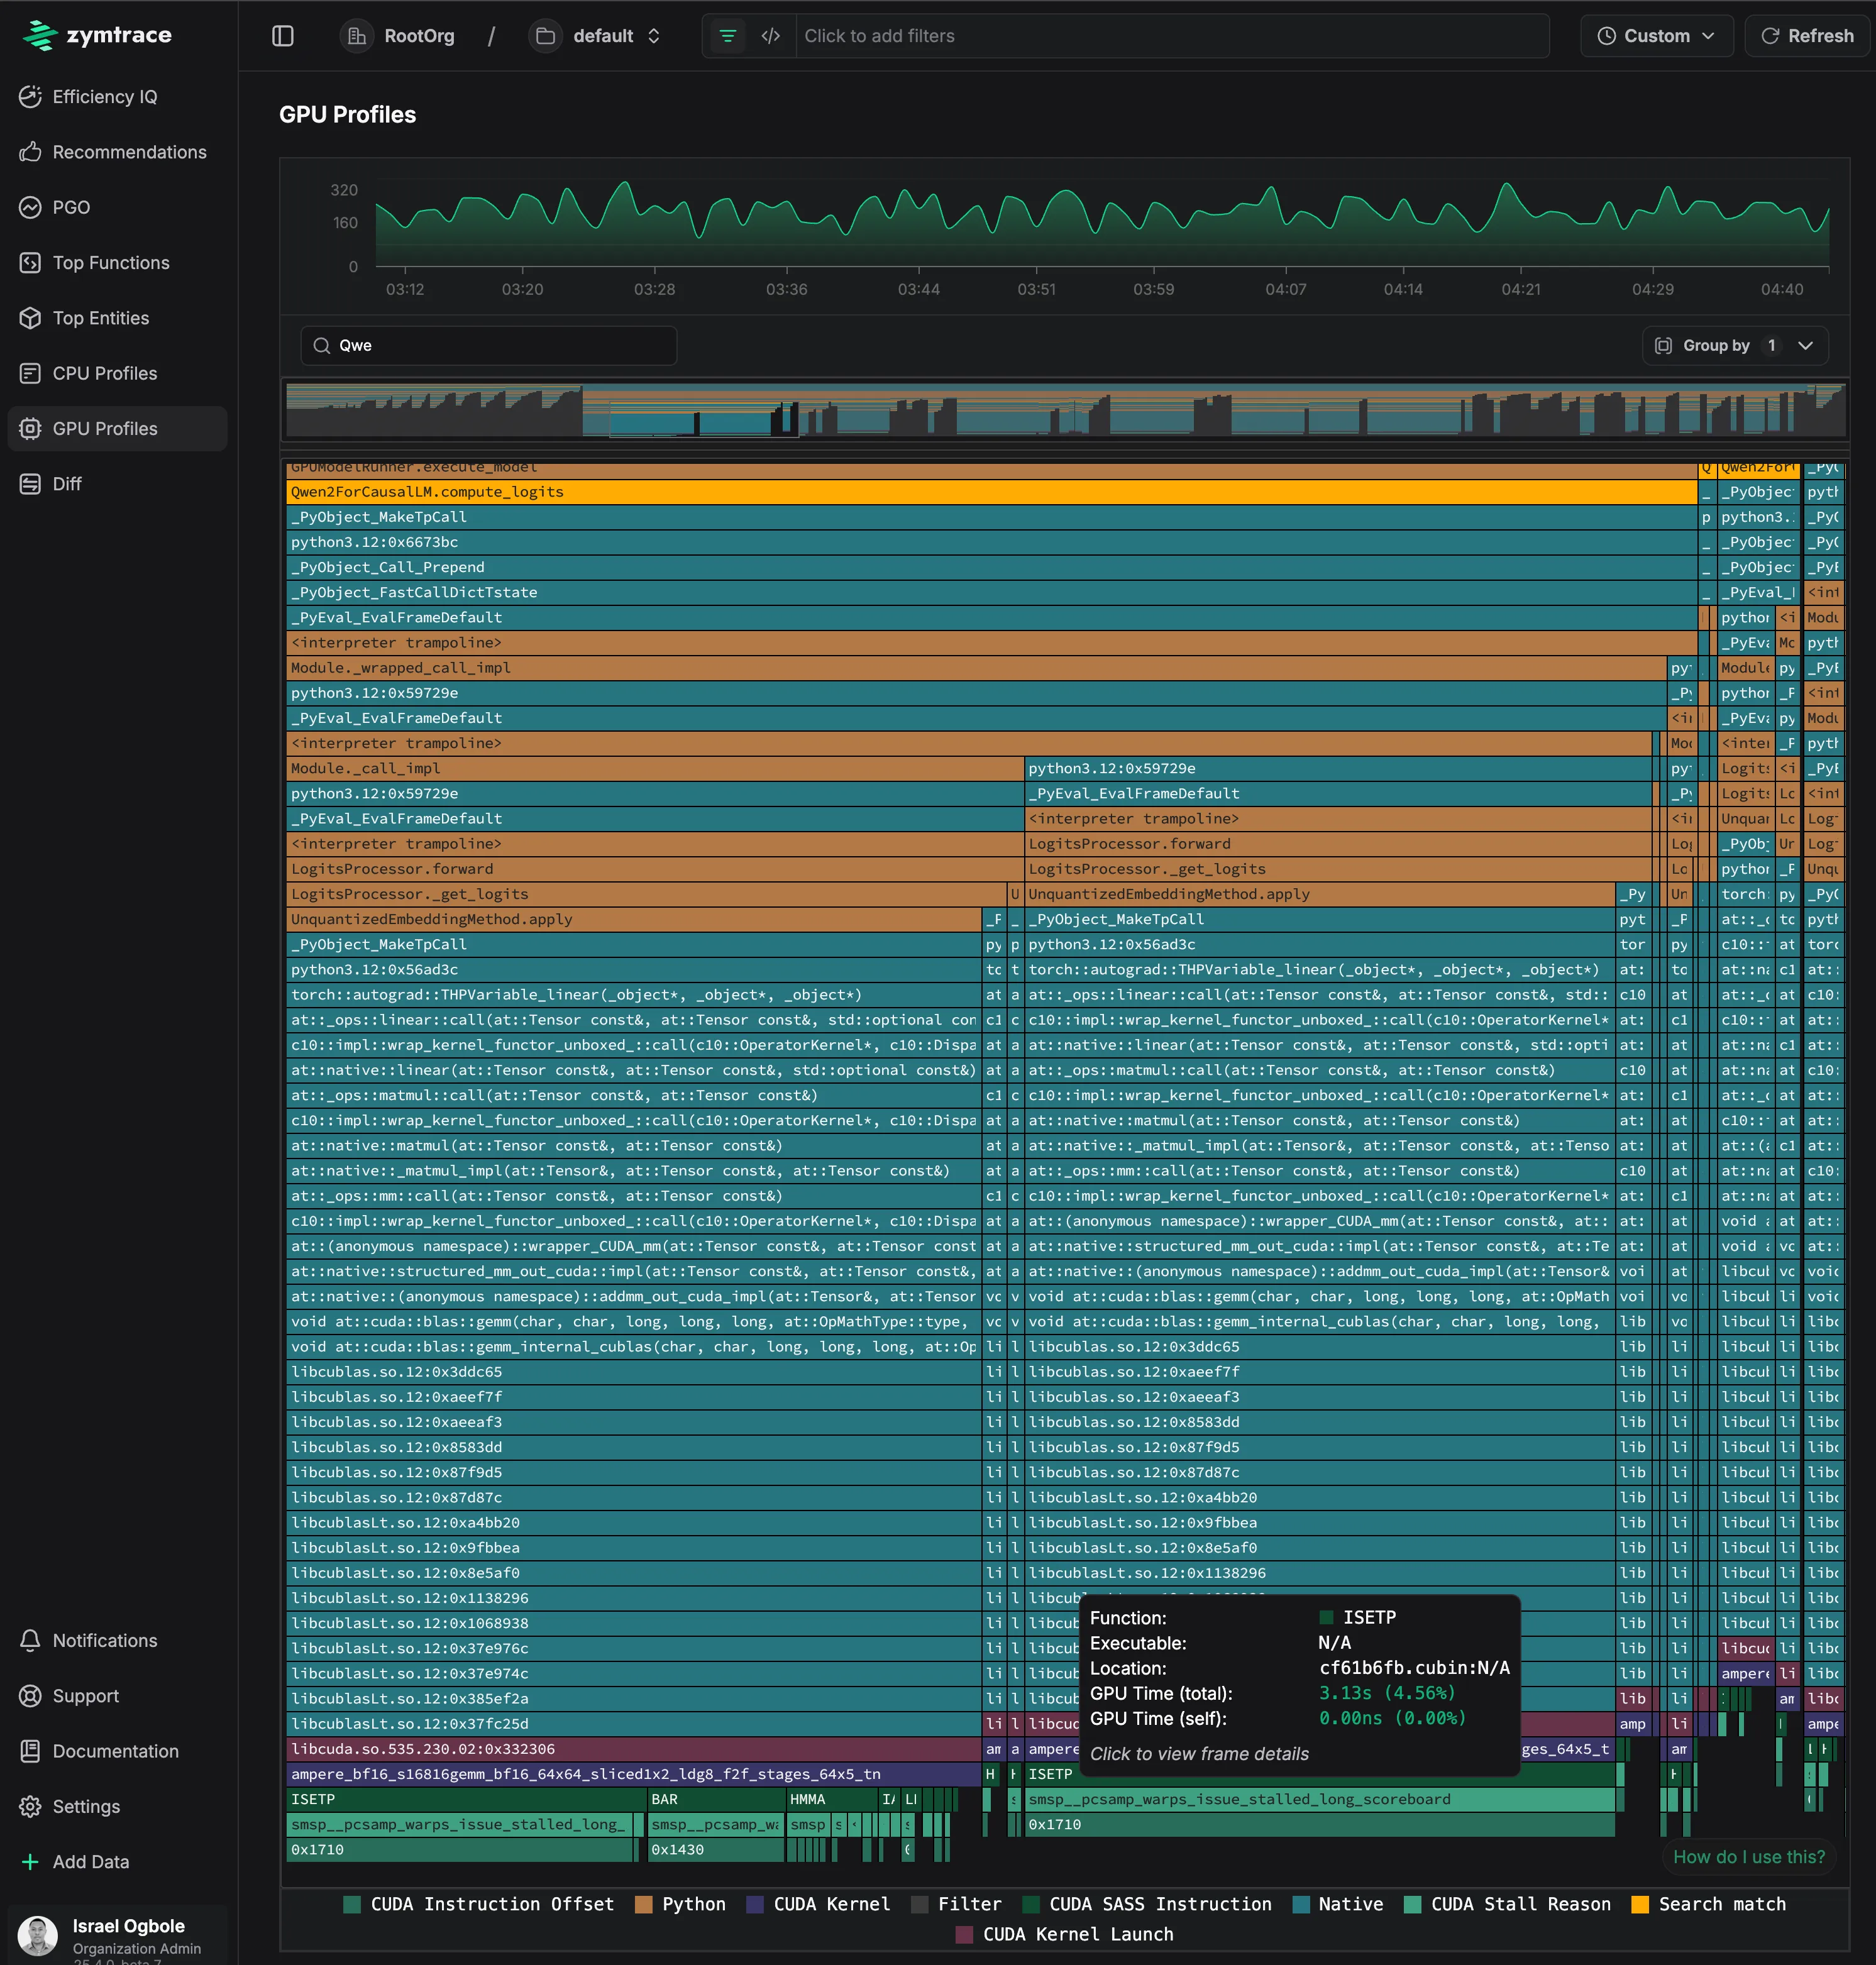
GPU Time
The flamegraph tooltip contains GPU Time, broken down into total time and self time.
GPU Time (Total)
For CPython and native frames, Total GPU time indicates the GPU time (also shown as a relative percentage) consumed by CUDA kernels launched by the function (including its callees). For CUDA frames, it reflects the time spent executing the function's body.
GPU Time (Self)
For CPython and native frames, Self GPU time is always zero, as these frames are not executed on the GPU. For CUDA frames, Self GPU time reflects the time spent executing only the function's own body on the GPU. If PC sampling is enabled, timing is broken down into stall reasons, instructions, and PC offsets, with Self GPU time attributed only to offsets, enabling a fine-grained view of what happened during the kernel execution.