MIG-Aware GPU Profiling
Zymtrace supports NVIDIA Multi-Instance GPU (MIG) devices. When MIG is enabled on a GPU, Zymtrace automatically detects the MIG topology and profiles each instance independently, with no additional configuration required.
What is MIG?
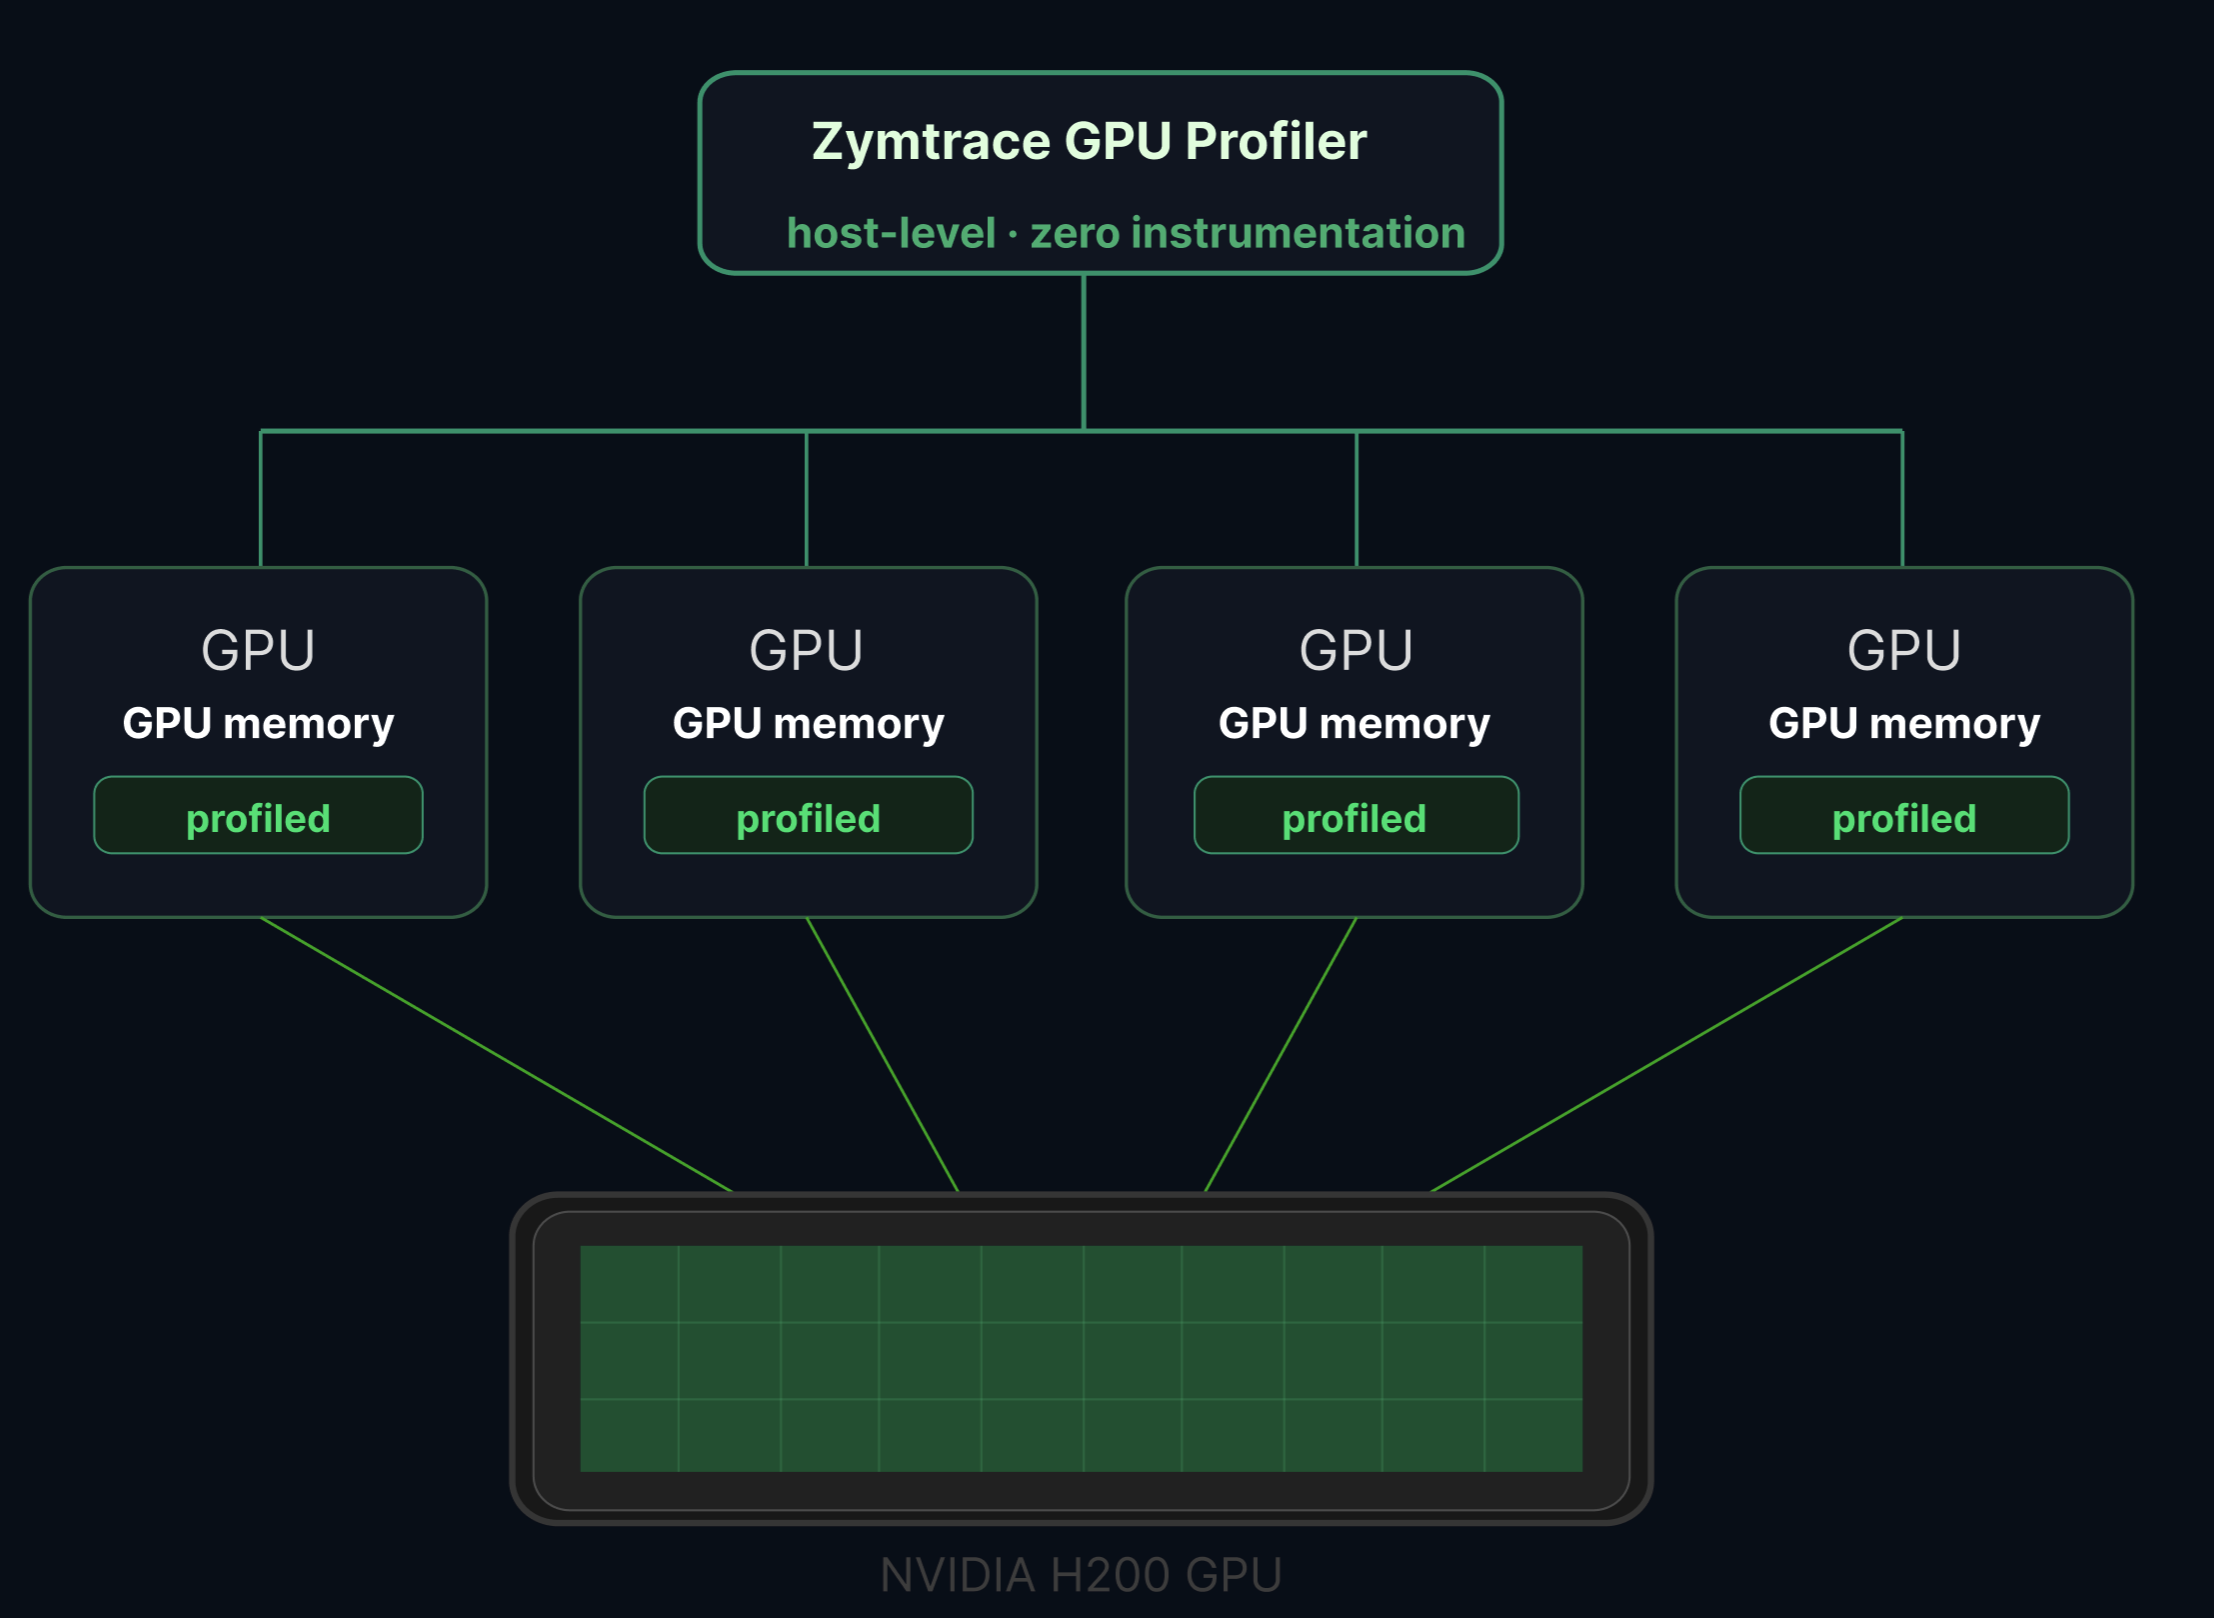
NVIDIA's Multi-Instance GPU (MIG) technology partitions a single physical GPU into up to seven fully isolated instances, each with its own dedicated high-bandwidth memory, cache, and compute cores. MIG is available on Hopper, Blackwell, and Rubin architectures.
MIG is commonly used in multi-tenant AI inference clusters where multiple models or users share the same hardware. Each MIG instance operates with full hardware-level isolation, ensuring that workloads on one slice cannot interfere with workloads on another.
How it works
Zymtrace detects MIG topology automatically from the host. If MIG is enabled, each instance appears as a separate device in the Zymtrace UI with its own:
- GPU utilization metrics
- Memory utilization metrics
- Tensor Core utilization metrics
- Full-stack GPU flamegraphs attributed to that specific instance
From any MIG instance, you can drill directly into a GPU flamegraph scoped to that slice: CPU call stacks correlated with GPU kernel activity, attributed to the exact MIG profile running your workload.
MIG detection is fully automatic. No code changes, no sidecars, no instrumentation, and no additional flags are required. If MIG is enabled on the host, Zymtrace sees it.
Requirements
- NVIDIA GPU with MIG support (Hopper, Blackwell, or Rubin architecture)
- MIG mode enabled on the GPU
- GPU metrics enabled in the Zymtrace profiler (
--enable-gpu-metrics)
Enabling MIG profiling
MIG support is included automatically when GPU metrics are enabled. Follow the standard GPU metrics setup to get started:
# MIG instances are detected automatically when GPU metrics are enabled
--enable-gpu-metrics --nvml-auto-scan
See the installation guide for Helm, Docker, binary, and systemd instructions.
Using MIG metrics
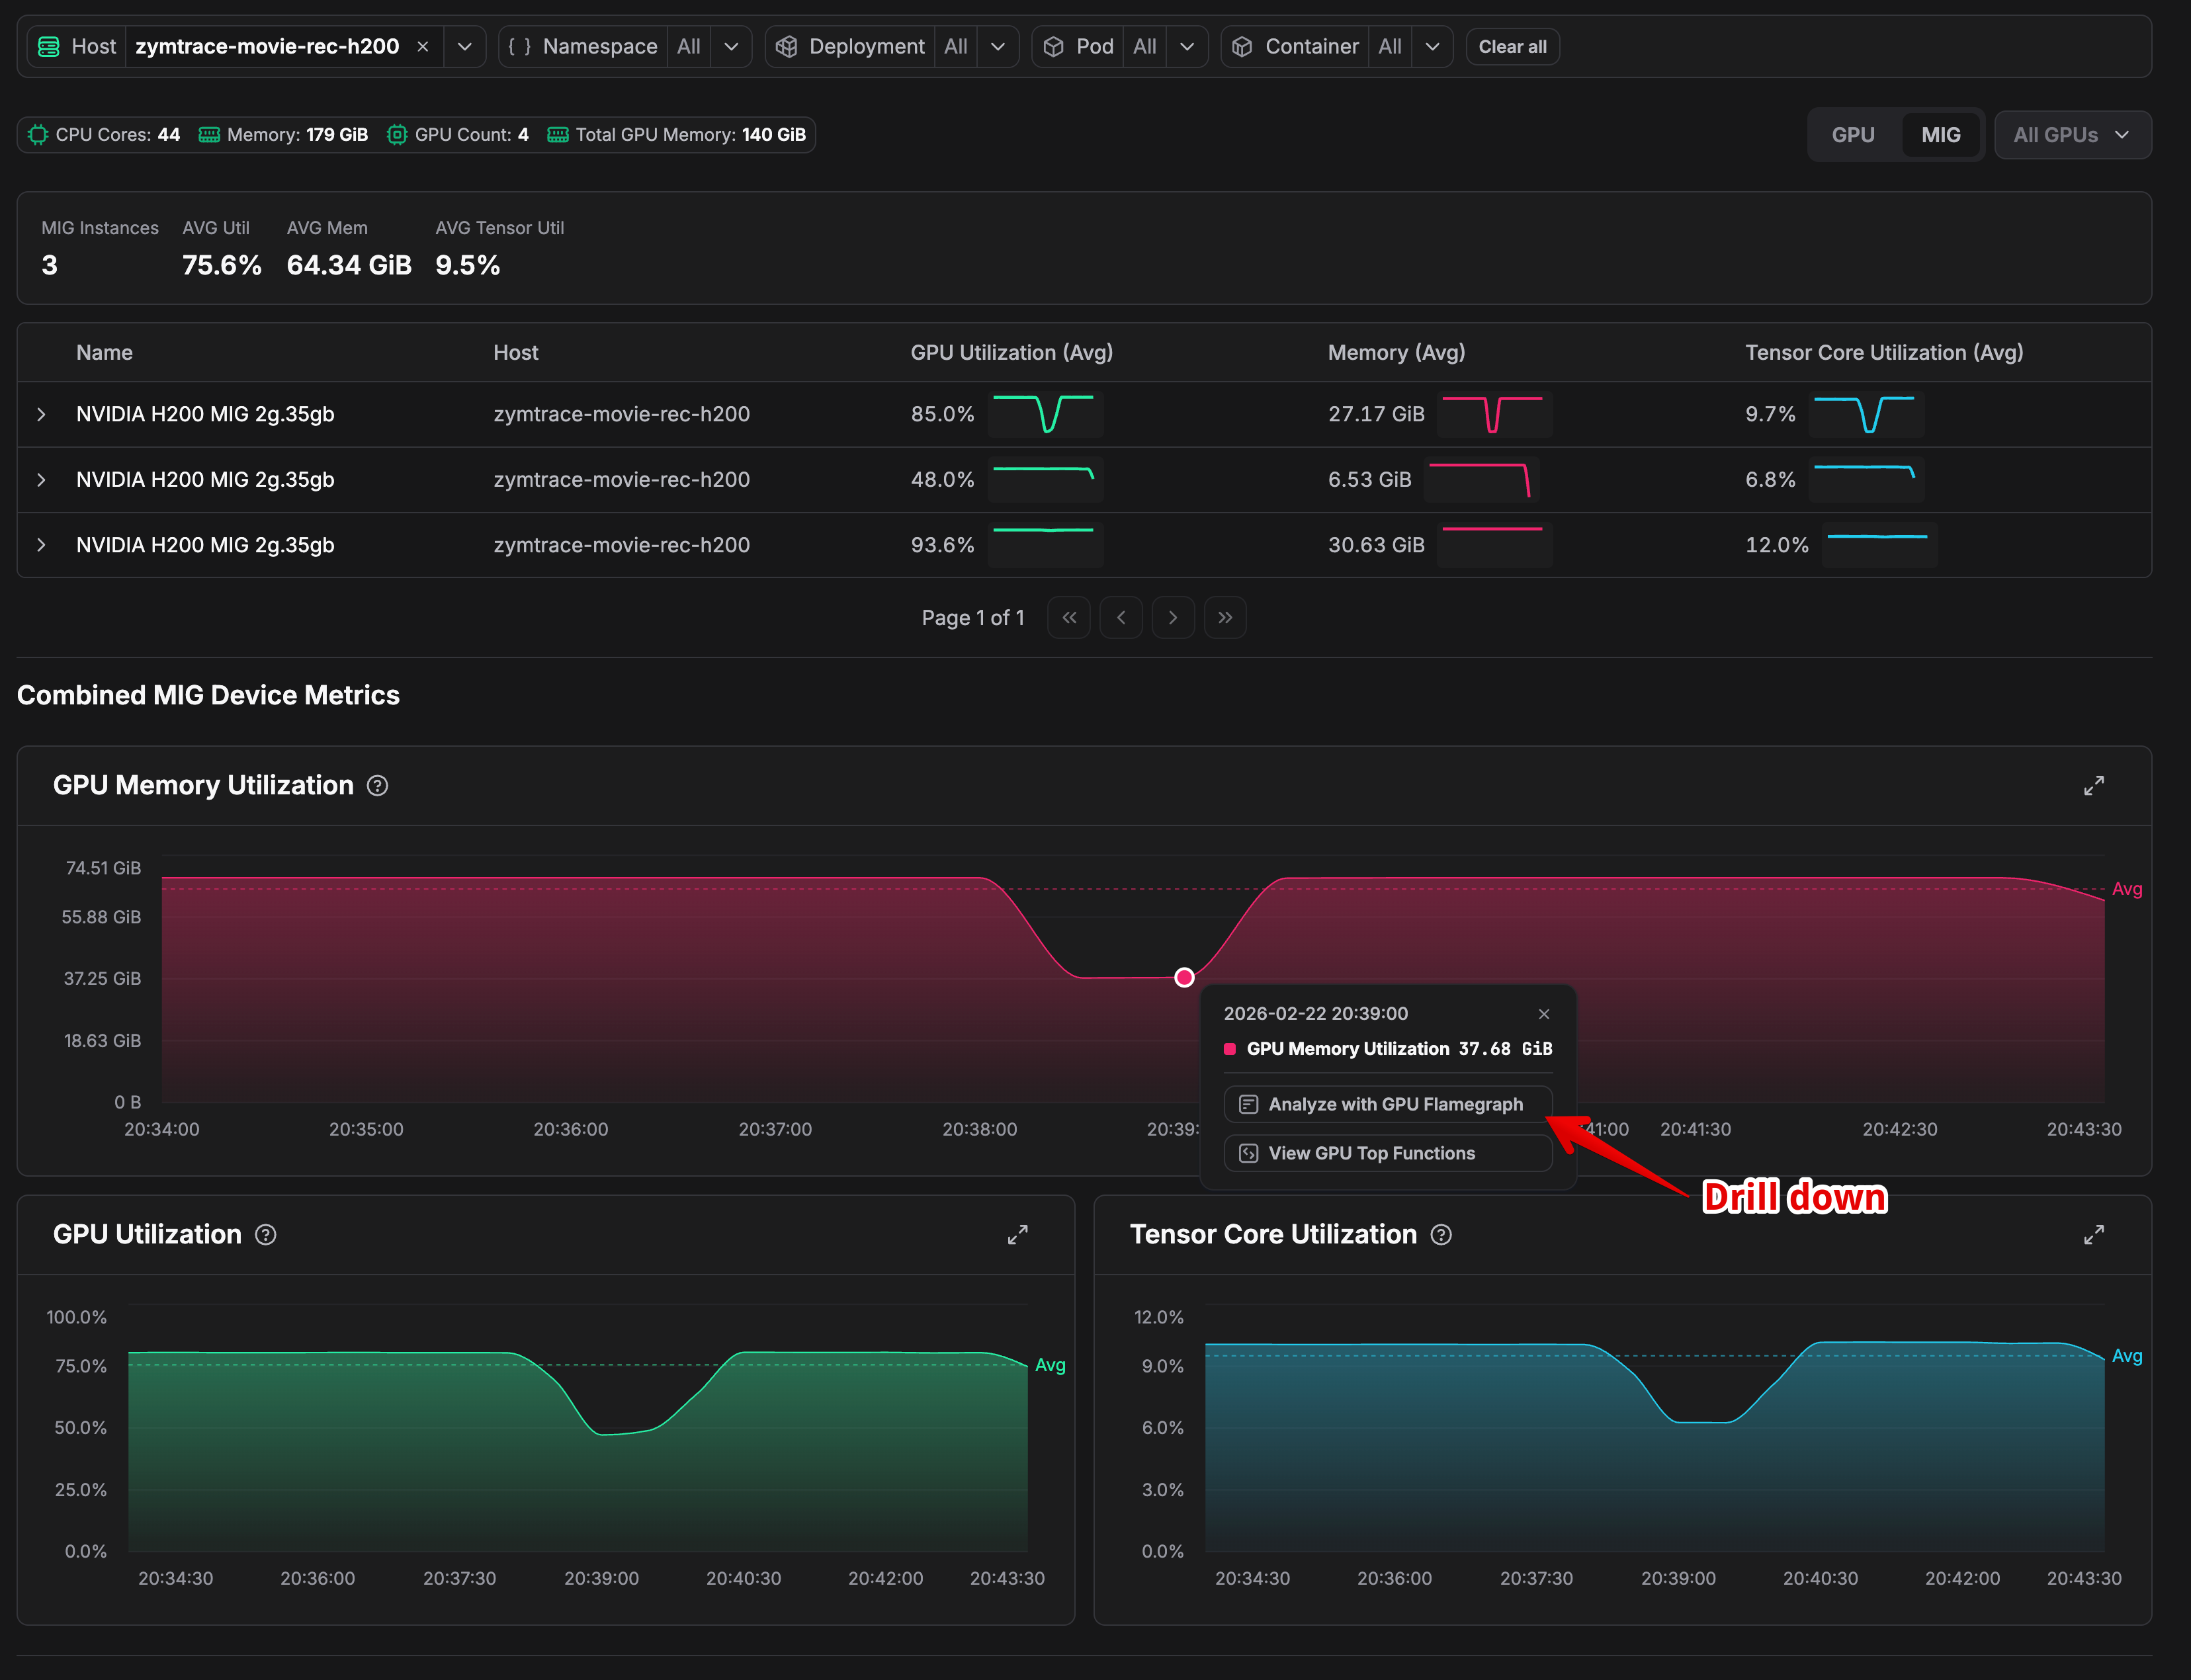
Once deployed on a node with MIG-enabled GPUs, navigate to Top Entities and select your GPU host. Each MIG instance appears as a separate device in the metrics dashboard, showing per-instance utilization, memory, and Tensor Core metrics.
Clicking on a specific MIG instance lets you drill down into the GPU flamegraph for that slice, enabling you to identify exactly which kernels or CPU code paths are responsible for performance issues on that particular instance.
Example
Consider three H200 2g.35gb MIG instances on the same node running at 85%, 48%, and 93.6% GPU utilization. Averaged at the physical GPU level, they appear reasonable. But the instance at 48% is severely underutilizing its allocated resources. A per-instance flamegraph surfaces exactly what is causing it to leave performance on the table.
Related
- GPU Metrics & Profiles — Enabling and using GPU metrics
- GPU Profiler Architecture — How CUDA profiling works in Zymtrace
- GPU Profiler Environment Variables — Configuration reference for GPU profiling