Symbolization
What is symbolization?
Symbolization is particularly critical for Zymtrace because we operate as a whole-system profiler. Unlike application performance monitoring (APM) tools and language-specific profilers that require code changes, runtime instrumentation, or language-specific agents, Zymtrace reads raw memory addresses directly from the system without touching your application's runtime or requiring any modifications to your code.
This non-intrusive approach means we collect instruction addresses exactly as they appear in memory during execution. Without symbolization, these profiles would show only hexadecimal addresses that are impossible to interpret or act upon. Symbolization transforms these raw instruction addresses into meaningful source code locations, bridging the gap between low-level system data and high-level developer understanding.
Native frames collected during software profiling require symbols to be useful. A symbol for a particular frame is a list of <file name, function name, source line> triplets. It is a list because compiler inlining may associate multiple functions and source lines to a single machine frame.
Native frames collected by the Zymtrace whole-system profiler may originate from:
- CUDA runtime and NVIDA GPU kernels
- System libraries (part of container images or the host OS)
- Operating system daemons
- Third-party software
- Native libraries used by in-house software
The symbolization challenge
Most production workloads strip debug symbols from binaries to reduce container image size and improve load times. Even when symbols are present, their quality varies significantly - many contain only basic function names without file locations or line numbers. This creates a gap between the raw addresses collected during profiling and the detailed source mappings developers need for effective optimization.
Our symbolization approach
Zymtrace addresses missing or low-quality symbols through a robust three-tier approach:
- Automatic symbol upload – The profiler automatically uploads symbols if available on the local system
- Global symbolization service – Falls back to pre-processed symbols for public libraries when local symbols are missing or insufficient
- Manual symbol upload – CLI tool for uploading proprietary symbols manually or via CI/CD pipeline for maximum quality
Symbol types and quality levels
All symbols processed and stored by Zymtrace—whether uploaded automatically, manually, or via the global symbolization service—are saved in the GSYM format. GSYM (Generic Symbol Format) is designed for compactness and fast lookups, making it ideal for large-scale symbolization databases and high-performance profiling workflows.
The quality and completeness of symbolization depends on the type of application and available debug information:
Interpreted languages
Applications written in interpreted languages (Python, JavaScript, Ruby, etc.) have file names and line numbers extracted directly from process memory. The exception is .NET applications, which require additional symbol processing.
Native applications
Native applications present varying levels of symbol quality depending on available debug information. Understanding these different symbol sources helps explain why some profiles show complete source locations while others only display function names.
ELF debug symbols (basic quality)
Executables with ELF (Executable and Linkable Format) debug symbols will only have function names, but no file names and line numbers. This is a hard limitation: ELF symbols simply don't store this information. The ELF format maintains function names and their memory addresses in symbol tables, but source location data like file paths and line numbers are not part of the ELF specification. This will generally be the case for most non-Go executables on production machines, where binaries are typically stripped of richer debug information to reduce container image sizes.
Go applications (basic quality)
Go executables (like our profiler) will also always only have function names extracted, from Go's internal reflection data structures. Unlike other languages that rely on external debug symbols, Go embeds metadata directly in the binary that allows runtime reflection. This provides reliable function name resolution even when traditional debug symbols are stripped. However, this is something that we intend to improve in the future, to also extract file names + lines from the Go meta-data, which would significantly enhance the debugging experience for Go services.
DWARF debug symbols (full quality)
Executables shipped with full DWARF debug symbols will have file names and line numbers, providing the most complete symbolization possible. DWARF (Debugging With Attributed Record Formats) includes detailed debug information including source file mappings, line number tables, and inline function call chains.
However, we don't enable DWARF symbol extraction in auto upload by default. You can engage it by passing the -dwarf flag to the profiler. DWARF is a horrendously complex format; parsing it will increase the peak memory footprint of the profiler by about 100MiB during extraction. DWARF info is also usually not present on production machines since it's typically stripped during deployment to reduce binary size—that's why it's opt-in for automatic uploads but enabled by default for manual uploads where the extraction happens offline.
Symbol extraction and merging
The symbol extraction code (both automatic and manual) extracts symbols from all available sources and merges them. In auto-upload, DWARF extraction is opt-in; in manual upload, it's the default. The system intelligently combines complementary information—for example, when an executable has both ELF and DWARF symbols, it merges function names from ELF with file and line information from DWARF.
Automatic symbol upload
The profiler automatically uploads symbols if available on the local system. This first-line approach:
- Scans for available symbols on running binaries
- Uploads whatever debug information is present
- Works seamlessly without user intervention
- Provides immediate symbolization for locally available symbols
However, most production workloads strip symbols or the quality of symbols is not good enough (function names only). The profiler uses global symbolization to address missing symbols or defaults to DWARF for better quality symbols where present.
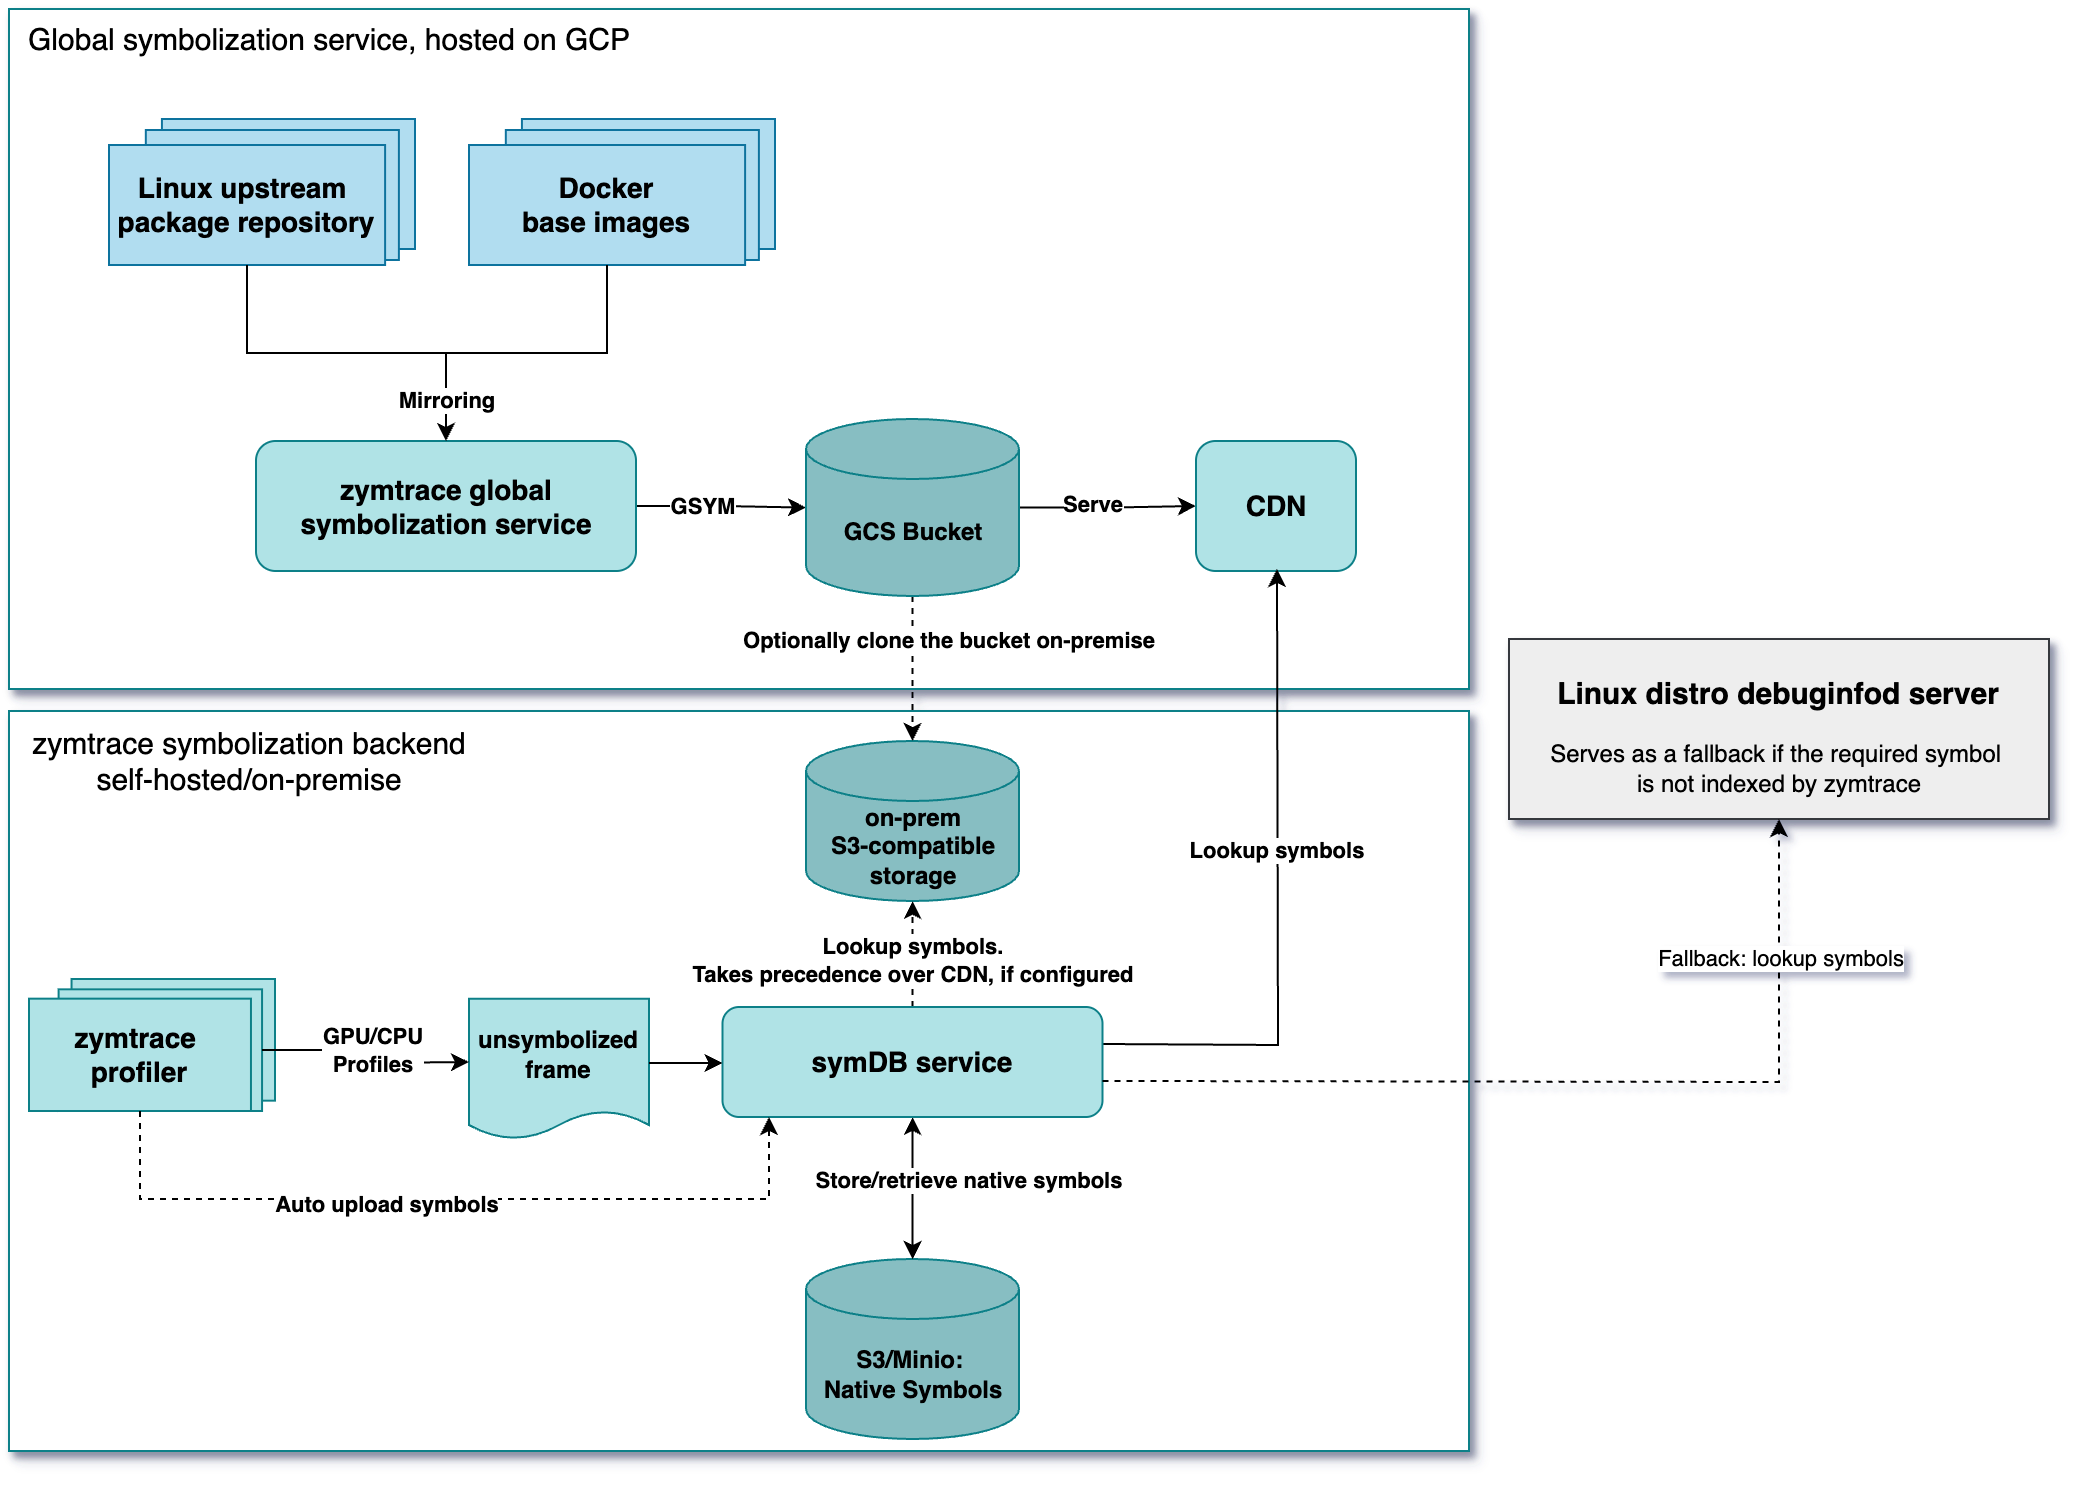
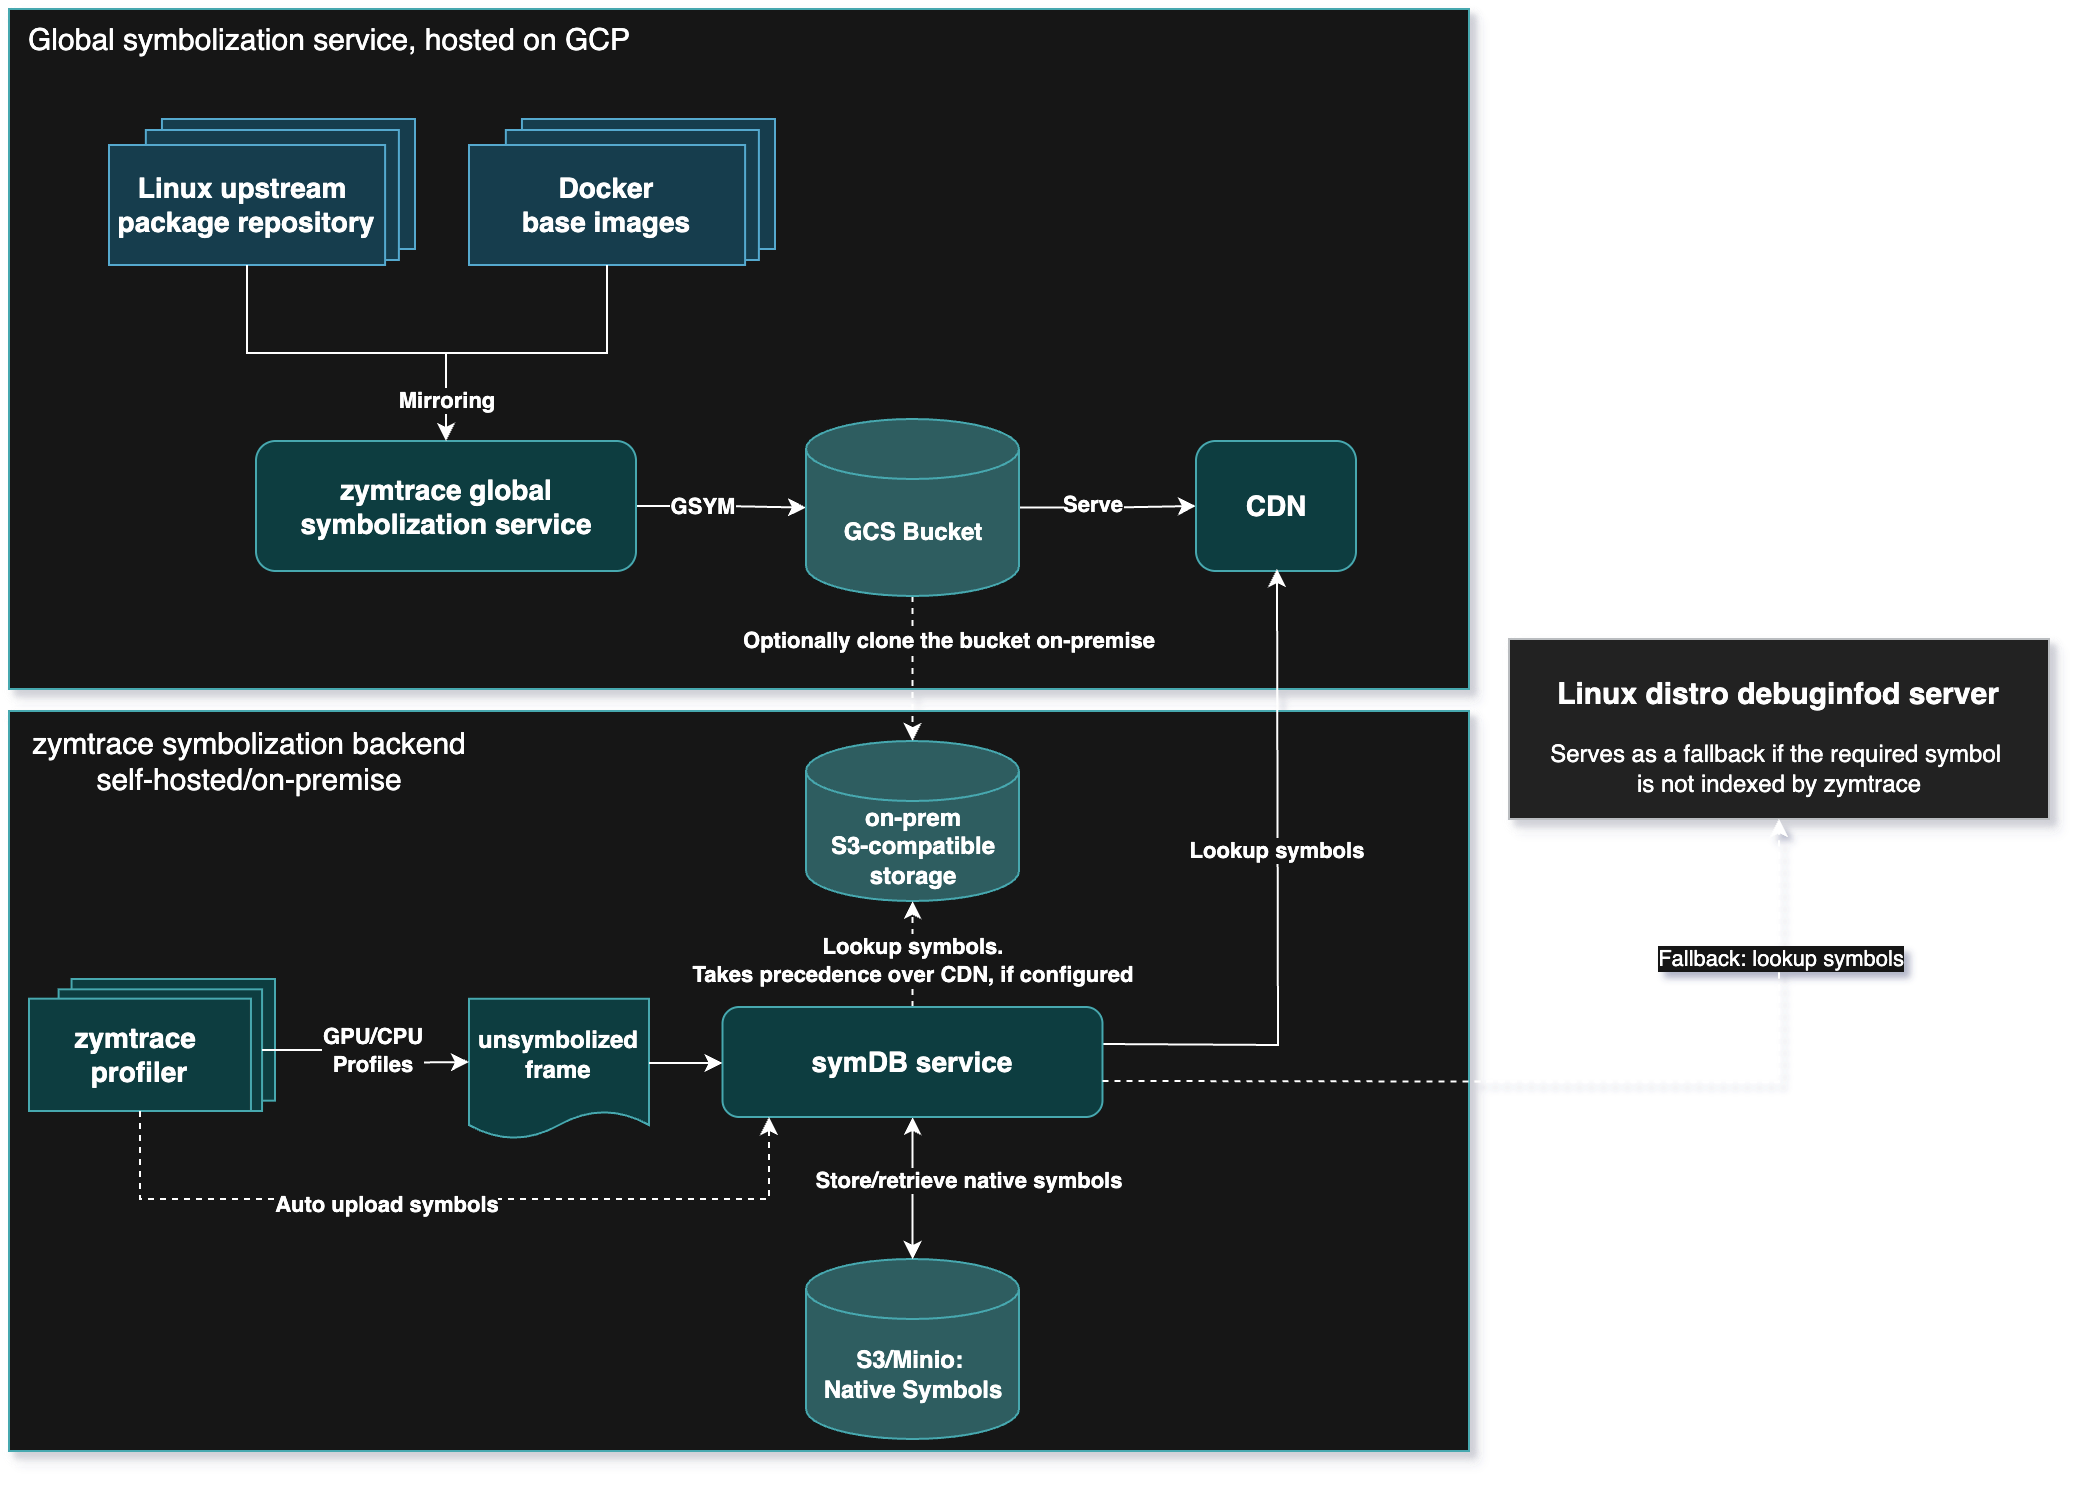
Global symbolization service
When automatic symbol upload doesn't provide adequate coverage, Zymtrace's global symbolization service acts as a fallback. This service:
- Crawls Debian, Alpine, and Ubuntu repositories, including popular Docker containers, for debug information
- Processes and stores debug symbols as GSYM files, a compact and efficient format for symbol information
- Indexes and stores these files in Google Cloud Storage
- Provides better quality symbols than are typically available locally
- Allows customers to clone this symbolization database for on-premises use
This approach ensures that common libraries and system components are automatically symbolized even when local debug information is unavailable or of poor quality.
Manual symbol upload
For proprietary software or when you need to ensure optimal symbol quality, Zymtrace provides a command-line tool for manual symbol upload. This approach offers several advantages:
- Maximum quality: Manual upload uses DWARF symbols by default, providing complete file names, function names, and line numbers
- Proprietary software support: Upload symbols for internal applications not covered by the global service
- CI/CD integration: Automate symbol uploads as part of your build and deployment pipeline
- Version control: Ensure symbols match your exact binary versions
- Custom control: Override automatic symbolization with your preferred symbols
The manual upload process can be run on-demand for immediate needs or integrated into CI/CD pipelines for automated symbol management. The tool extracts symbols from all available sources and merges them to provide comprehensive coverage.
This process is documented in detail on the uploading symbols page.
Choosing the right approach
The three-tier symbolization system works together to provide a great symbolization experience.
- Start with automatic upload for immediate, zero-configuration symbolization
- Leverage global symbolization for extensive coverage of common libraries and system components
- Use manual upload for proprietary software, optimal quality, or CI/CD integration
In most cases, the automatic upload and global symbolization service provide excellent coverage with minimal effort. Manual upload is recommended when you need guaranteed symbol quality or are working with proprietary binaries not covered by the global service.