Allocation Profiling
zymtrace can sample memory allocations alongside CPU profiles, letting you attribute heap pressure and GC overhead back to the call paths that produced it.
Why zymtrace's approach is different:
- No library injection — we don't load any shared library into the target JVM. Your application's process image is untouched.
- Low overhead — sample-based, interval-driven collection (e.g. one sample per
16miballocated) keeps the cost down for steady-state production workloads. - On-demand, time-limited — turn it on when you need it, off (or auto-expired) when you don't. Rules carry an expiry so allocation profiling never runs longer than you intended.
- Scoped via rules — target a specific container, deployment, host, or project with a CEL expression. No global toggles, no agent restarts.
Allocation Profiles is currently only supported for Java (OpenJDK, Zulu, and Zing). Need it for Python or another language? Reach out on Slack or email [email protected].
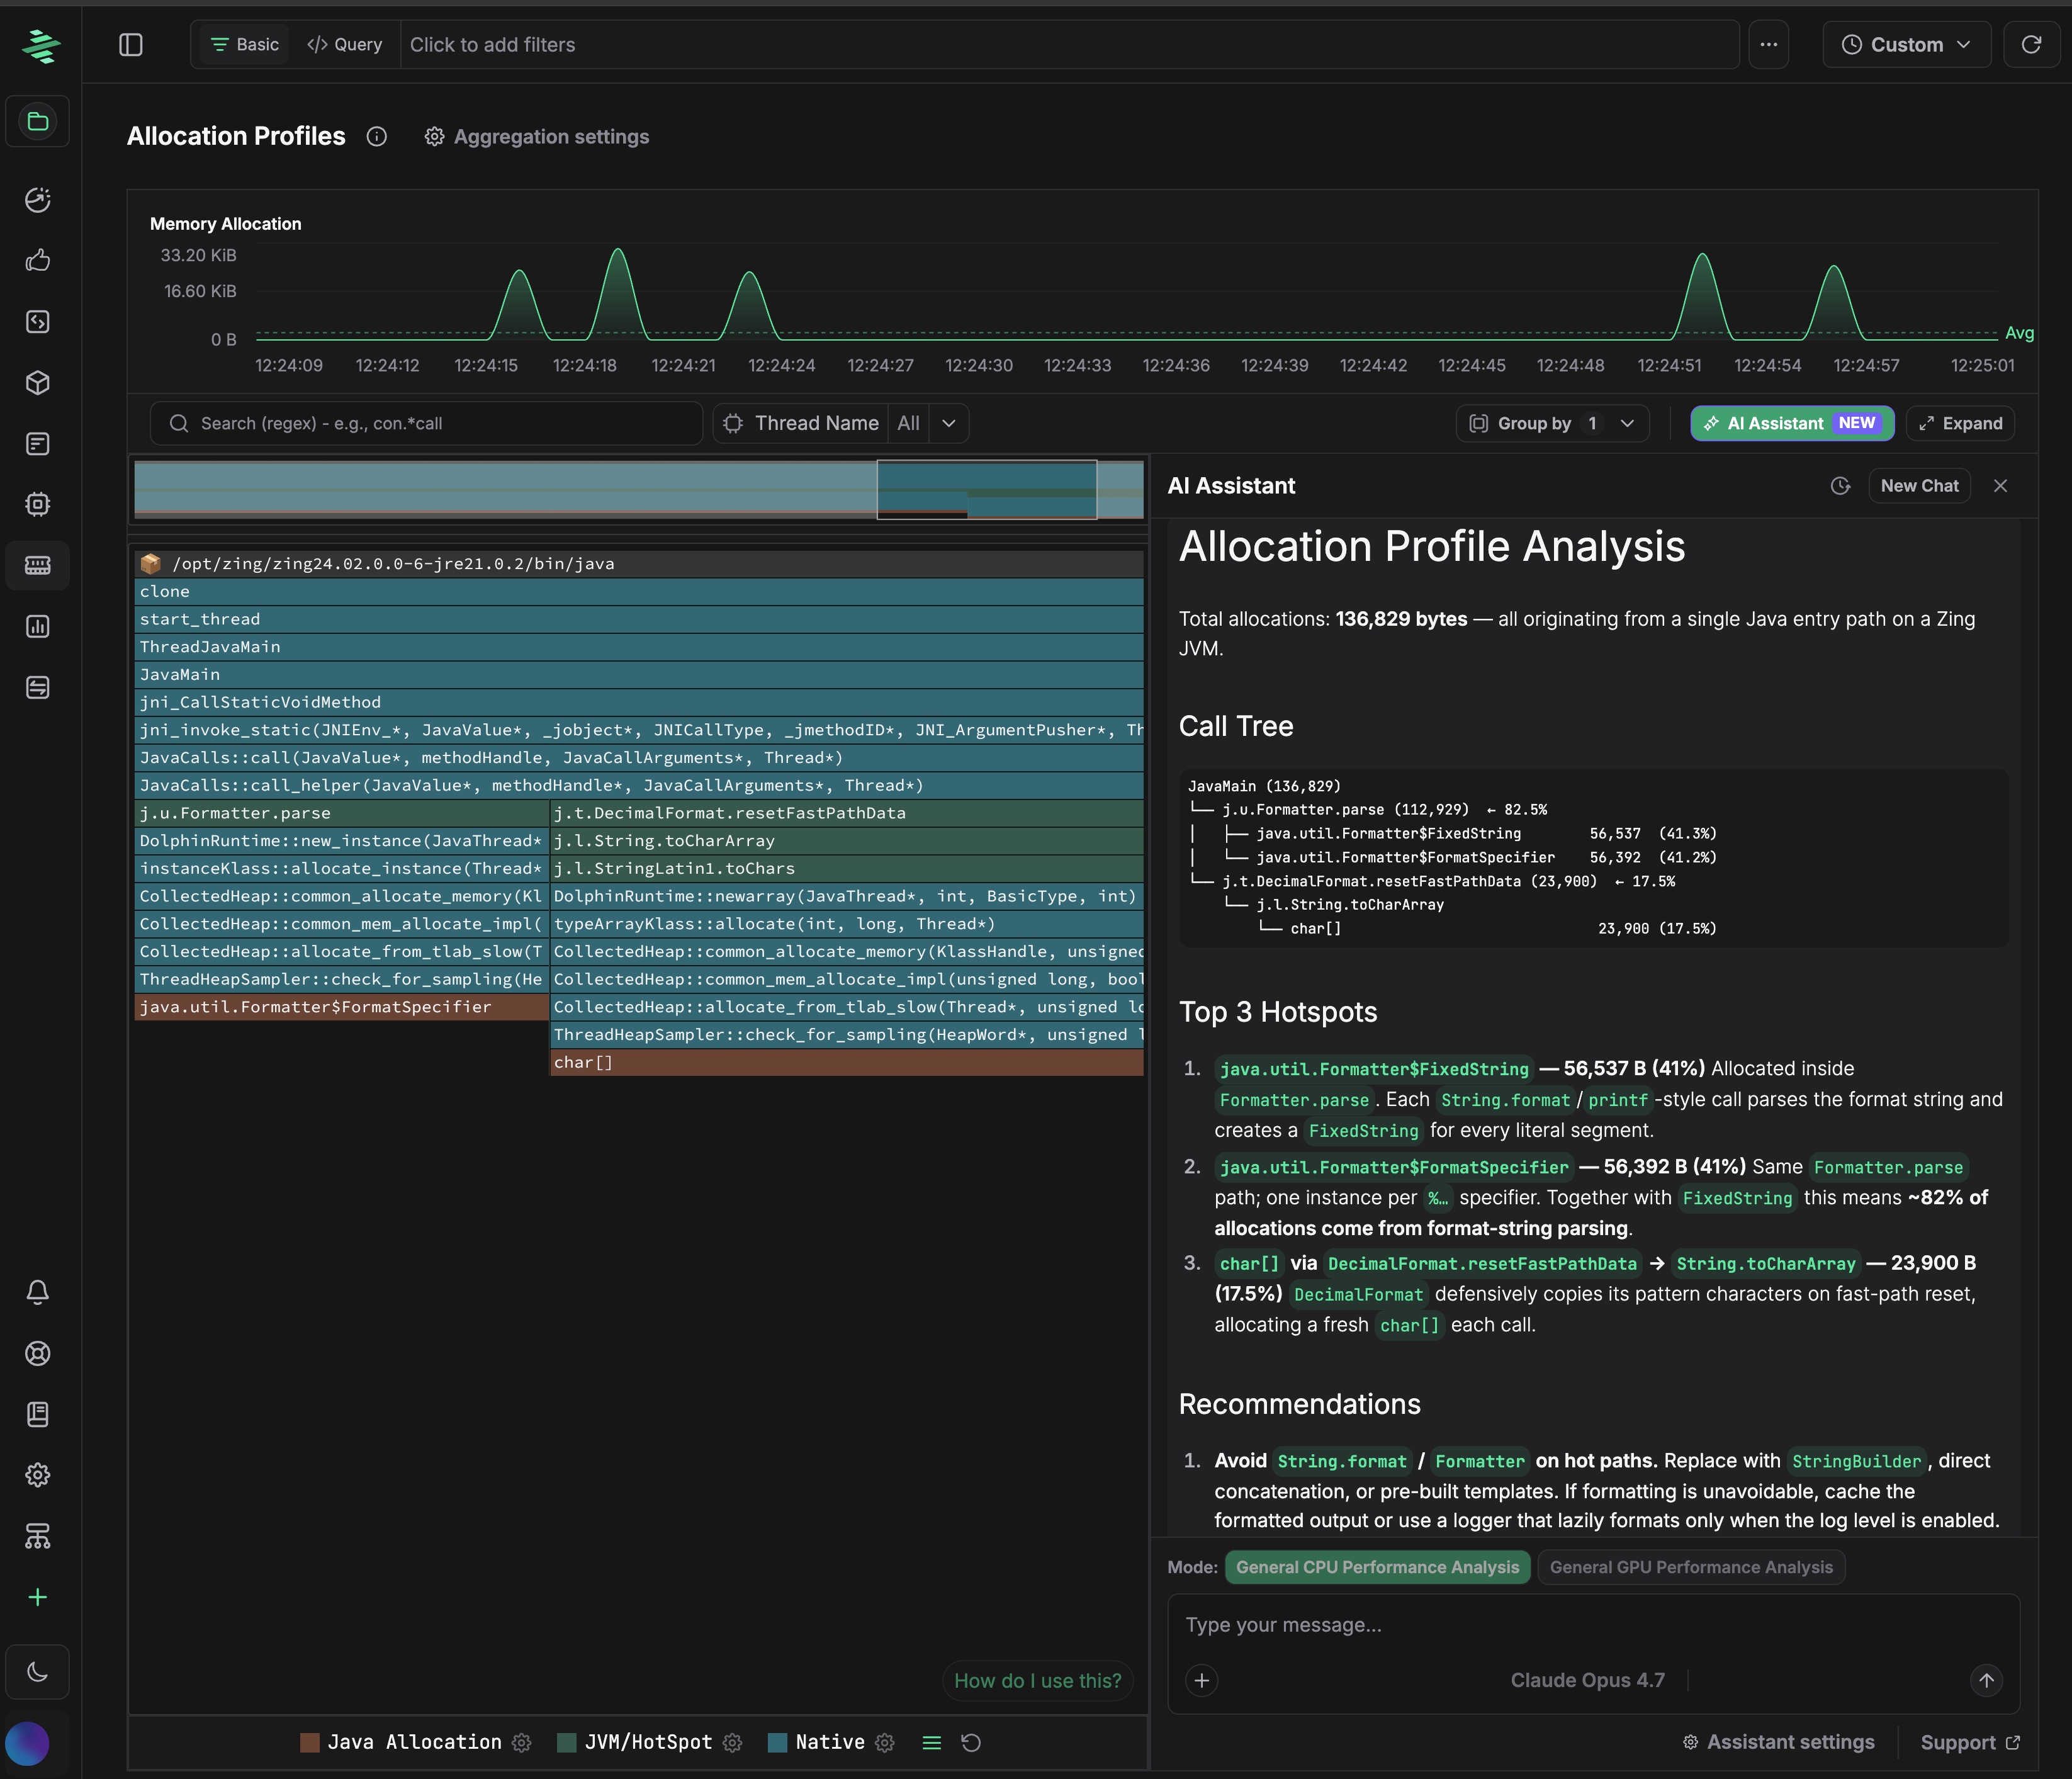
The Allocation Profiles view shows a memory-allocation flamegraph, a per-thread breakdown, and (when enabled) an AI Assistant pass that summarises the hottest allocation paths and suggests concrete fixes.
How it works
zymtrace uses a custom sampling method built on what is backing JVMTI. This gives us the benefits of low-overhead JVMTI allocation sampling without the drawbacks — namely, we don't have to load any shared libraries into the target process. Supported for OpenJDK, Zulu, and Zing; the JVMTI-backed path is used by default and can be disabled with -use-jvmti=false.
Sampling is interval-based: you specify a size (e.g. 16mib) and zymtrace records one allocation sample per that many bytes allocated. Smaller intervals give finer detail at higher overhead; larger intervals are cheaper and suitable for steady-state production workloads.
Enabling allocation profiling
There are two ways to turn allocation profiling on. We recommend the UI — it lets you toggle it on-demand and scope the configuration to specific hosts or processes without redeploying the agent.
Option 1 (recommended): from the UI
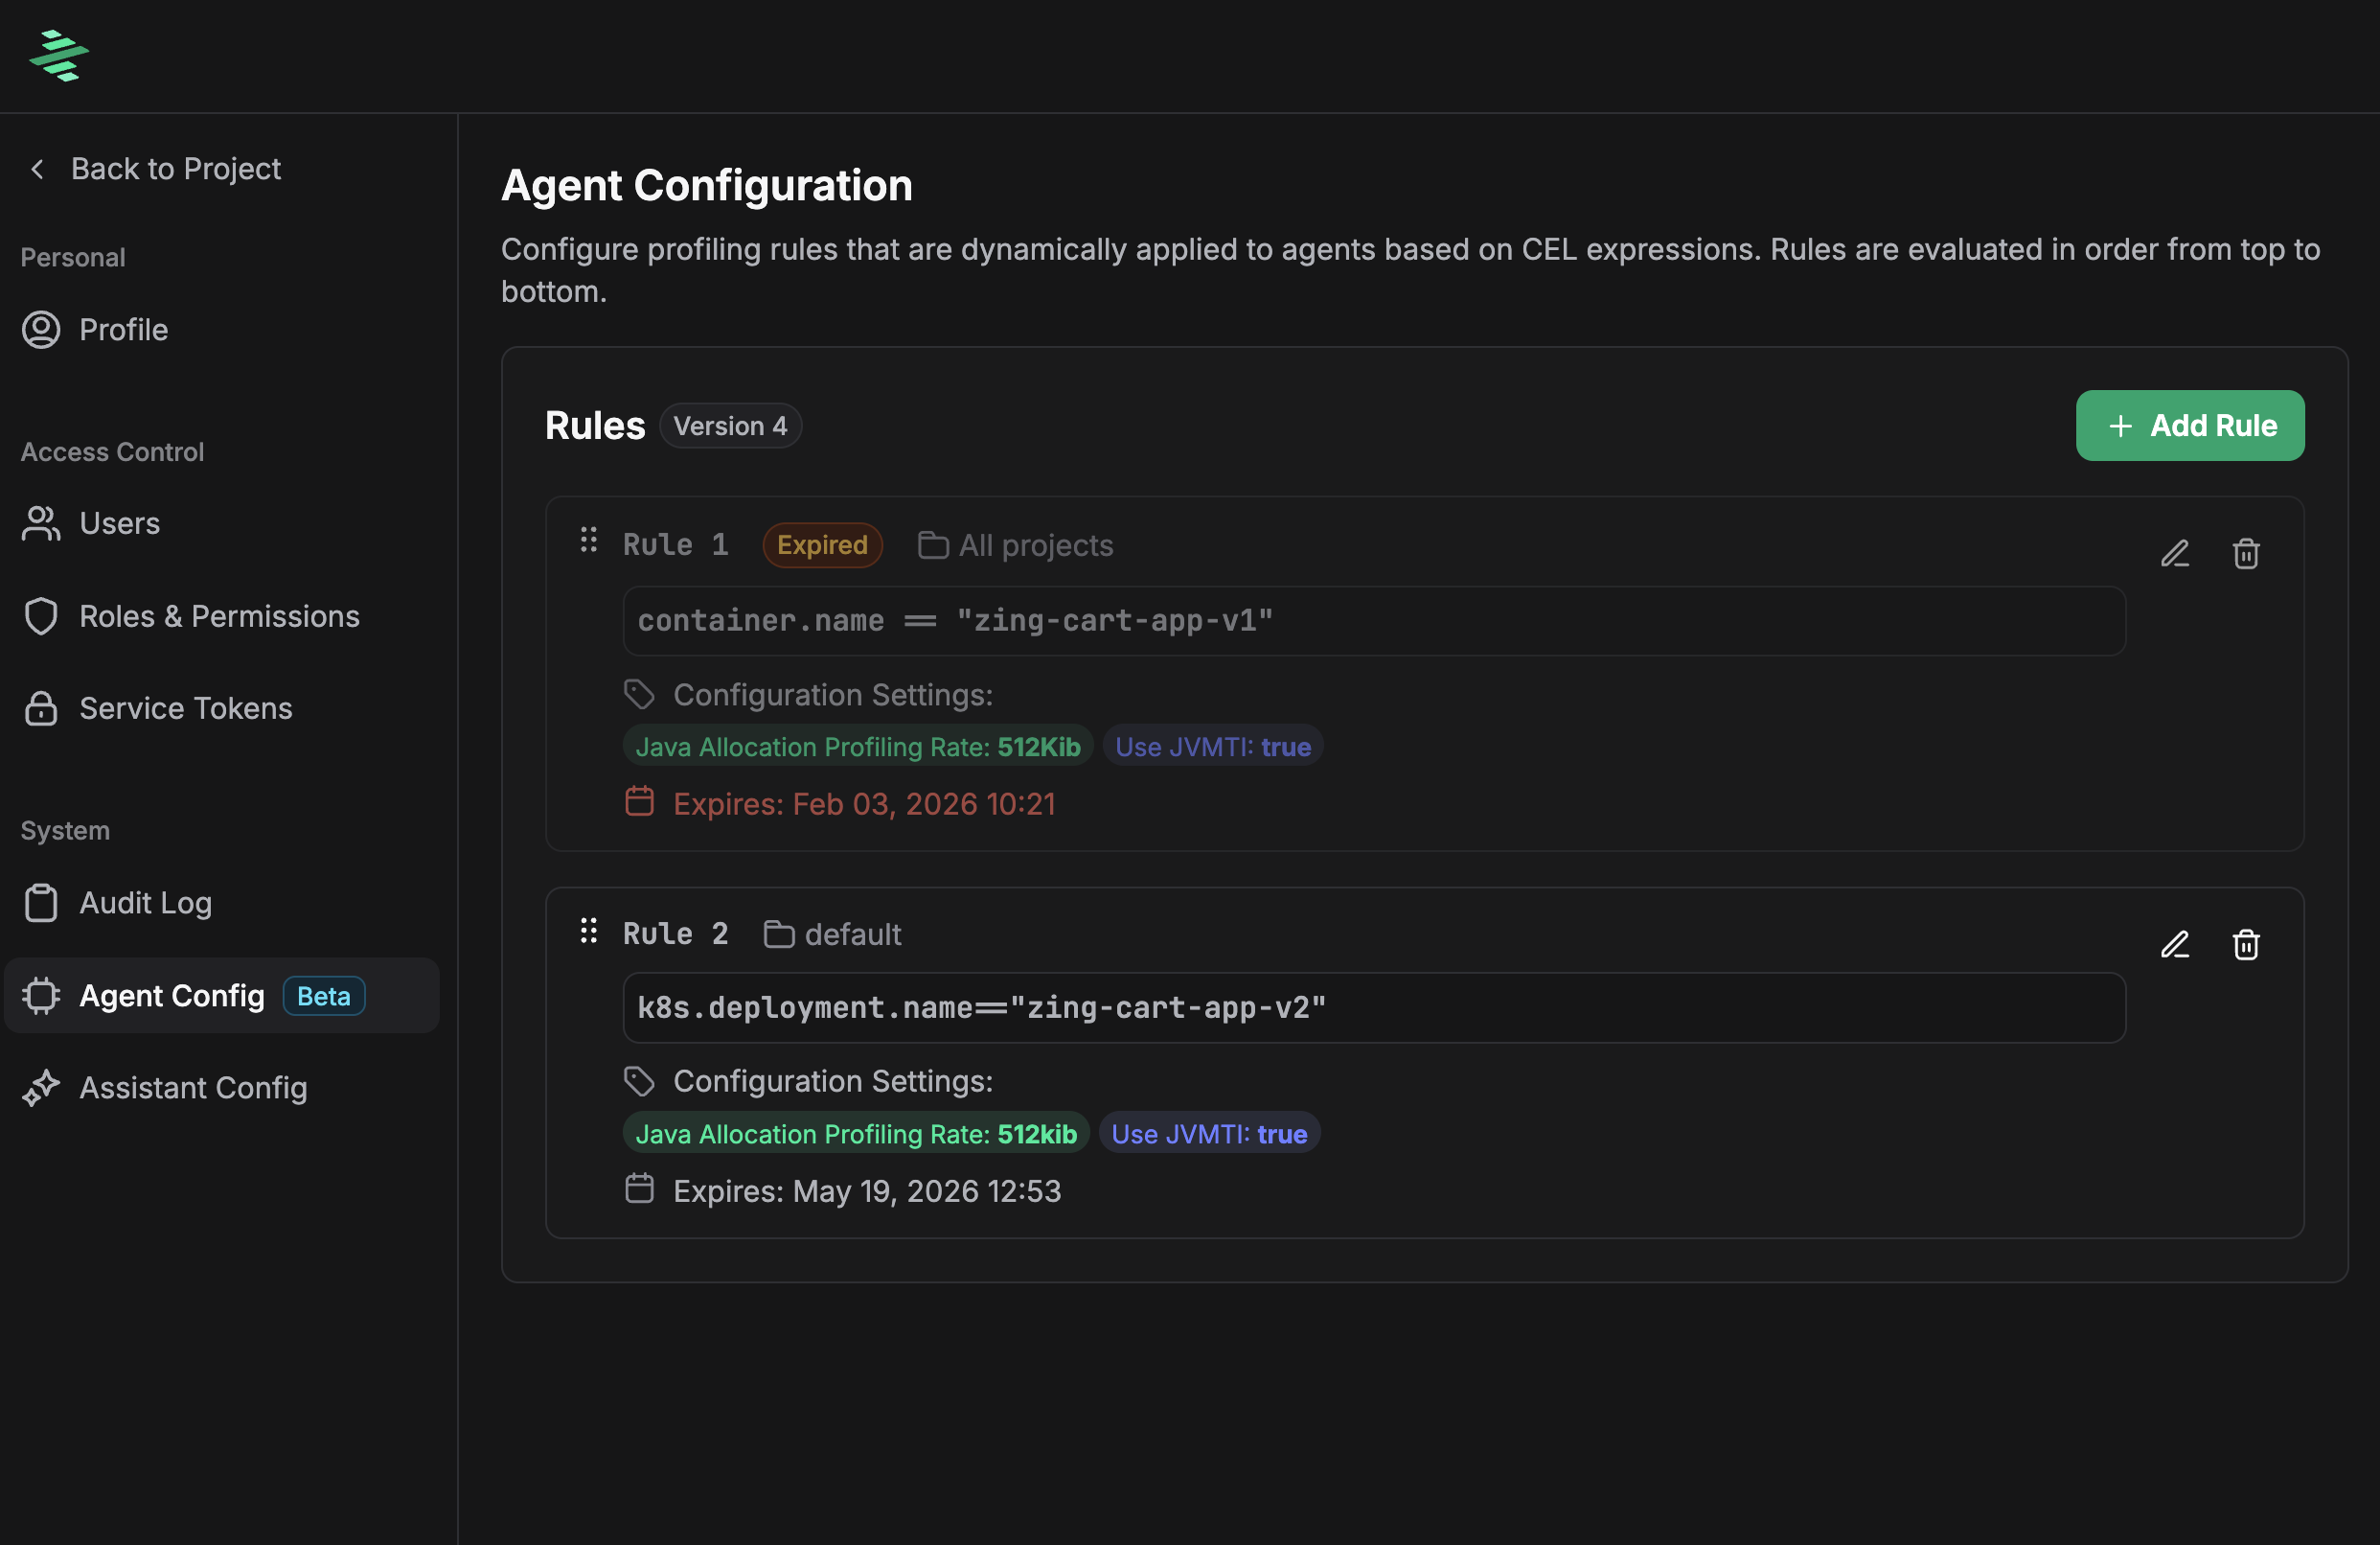
In the UI, allocation profiling is enabled via an agent rule — a CEL expression that targets specific containers, deployments, hosts, or projects, with the sampling rate and JVMTI flag attached. Rules are evaluated top-to-bottom, take effect on the next profiler reporter interval, and don't require an agent restart.
There are two ways to create an agent rule:
Agent Config page — go to Settings → Agent Config. You'll see the existing rules and can click + Add Rule to author one directly with a CEL expression and configuration settings.
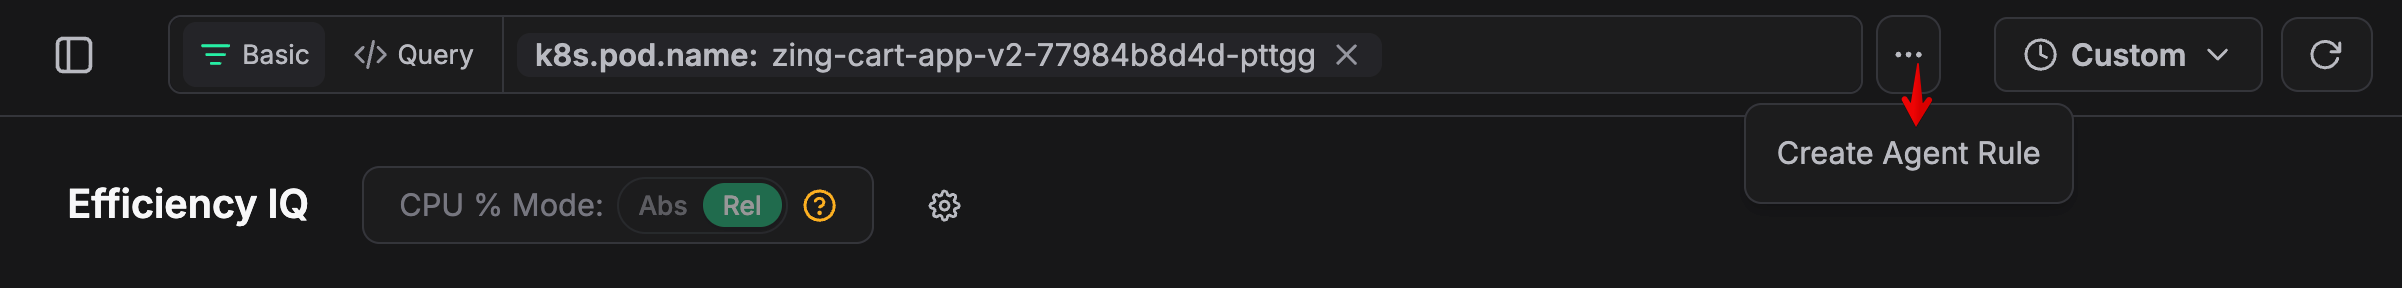
Shortcut from the Allocation Profiles page — open the Allocation Profiles page, add filters for the specific app, container, or deployment you care about, and click the Create Agent Rule shortcut. The filters are translated into the CEL expression for you, so you only have to pick the sampling rate.
Option 2: via profiler configuration
Pass -alloc-profile <size> (or set ZYMTRACE_ALLOC_PROFILE=<size>) on the profiler at startup. This applies globally to whatever the agent profiles and requires redeploying the DaemonSet / restarting the binary to change.
sudo ./zymtrace-profiler \
  -collection-agent=gateway.company.com:443 \
  -alloc-profile=16mib
Common values:
-alloc-profile=512kib— fine-grained sampling, higher overhead-alloc-profile=16mib— typical default for production workloads
| CLI Argument | Environment Variable | Description |
|---|---|---|
-alloc-profile | ZYMTRACE_ALLOC_PROFILE | Enable allocation profiling. Takes a sampling interval size, e.g., -alloc-profile 16mib. Default is "" (disabled). |
-use-jvmti | ZYMTRACE_USE_JVMTI | Control whether JVMTI is used as the sampling backend. Default is true (when supported). Set to false to disable. |
Related
- Profiler ENV and CLI Args — full profiler configuration reference
- Supported languages — current Java version coverage