Add Data
The zymtrace agent is a continuous sampling profiler that uses eBPF to observe user-space and kernel-space stack traces with very low overhead. The agent needs to be installed and configured on every machine that you want to profile. It does not require code changes, restarts or recompilation.
Supported Languages
zymtrace profiles any process that consumes computational resources, including kernel code and third-party libraries. It offers extended support for a wide range of languages, including C/C++, Go, Java (and other JVM languages), Node.js/V8, .NET, Perl, PHP, Python, Ruby, Rust and Zig.
The minimum supported versions of each interpreter are:
- .NET: 6
- JVM/JDK: 7
- Node.js/V8: 8.1.0
- Perl: 5.28
- PHP: 7.3
- Python: 3.6
- Ruby: 2.5
CUDA and specific support for PyTorch will be added in the near future with our GPU profiling solution.
Custom configuration
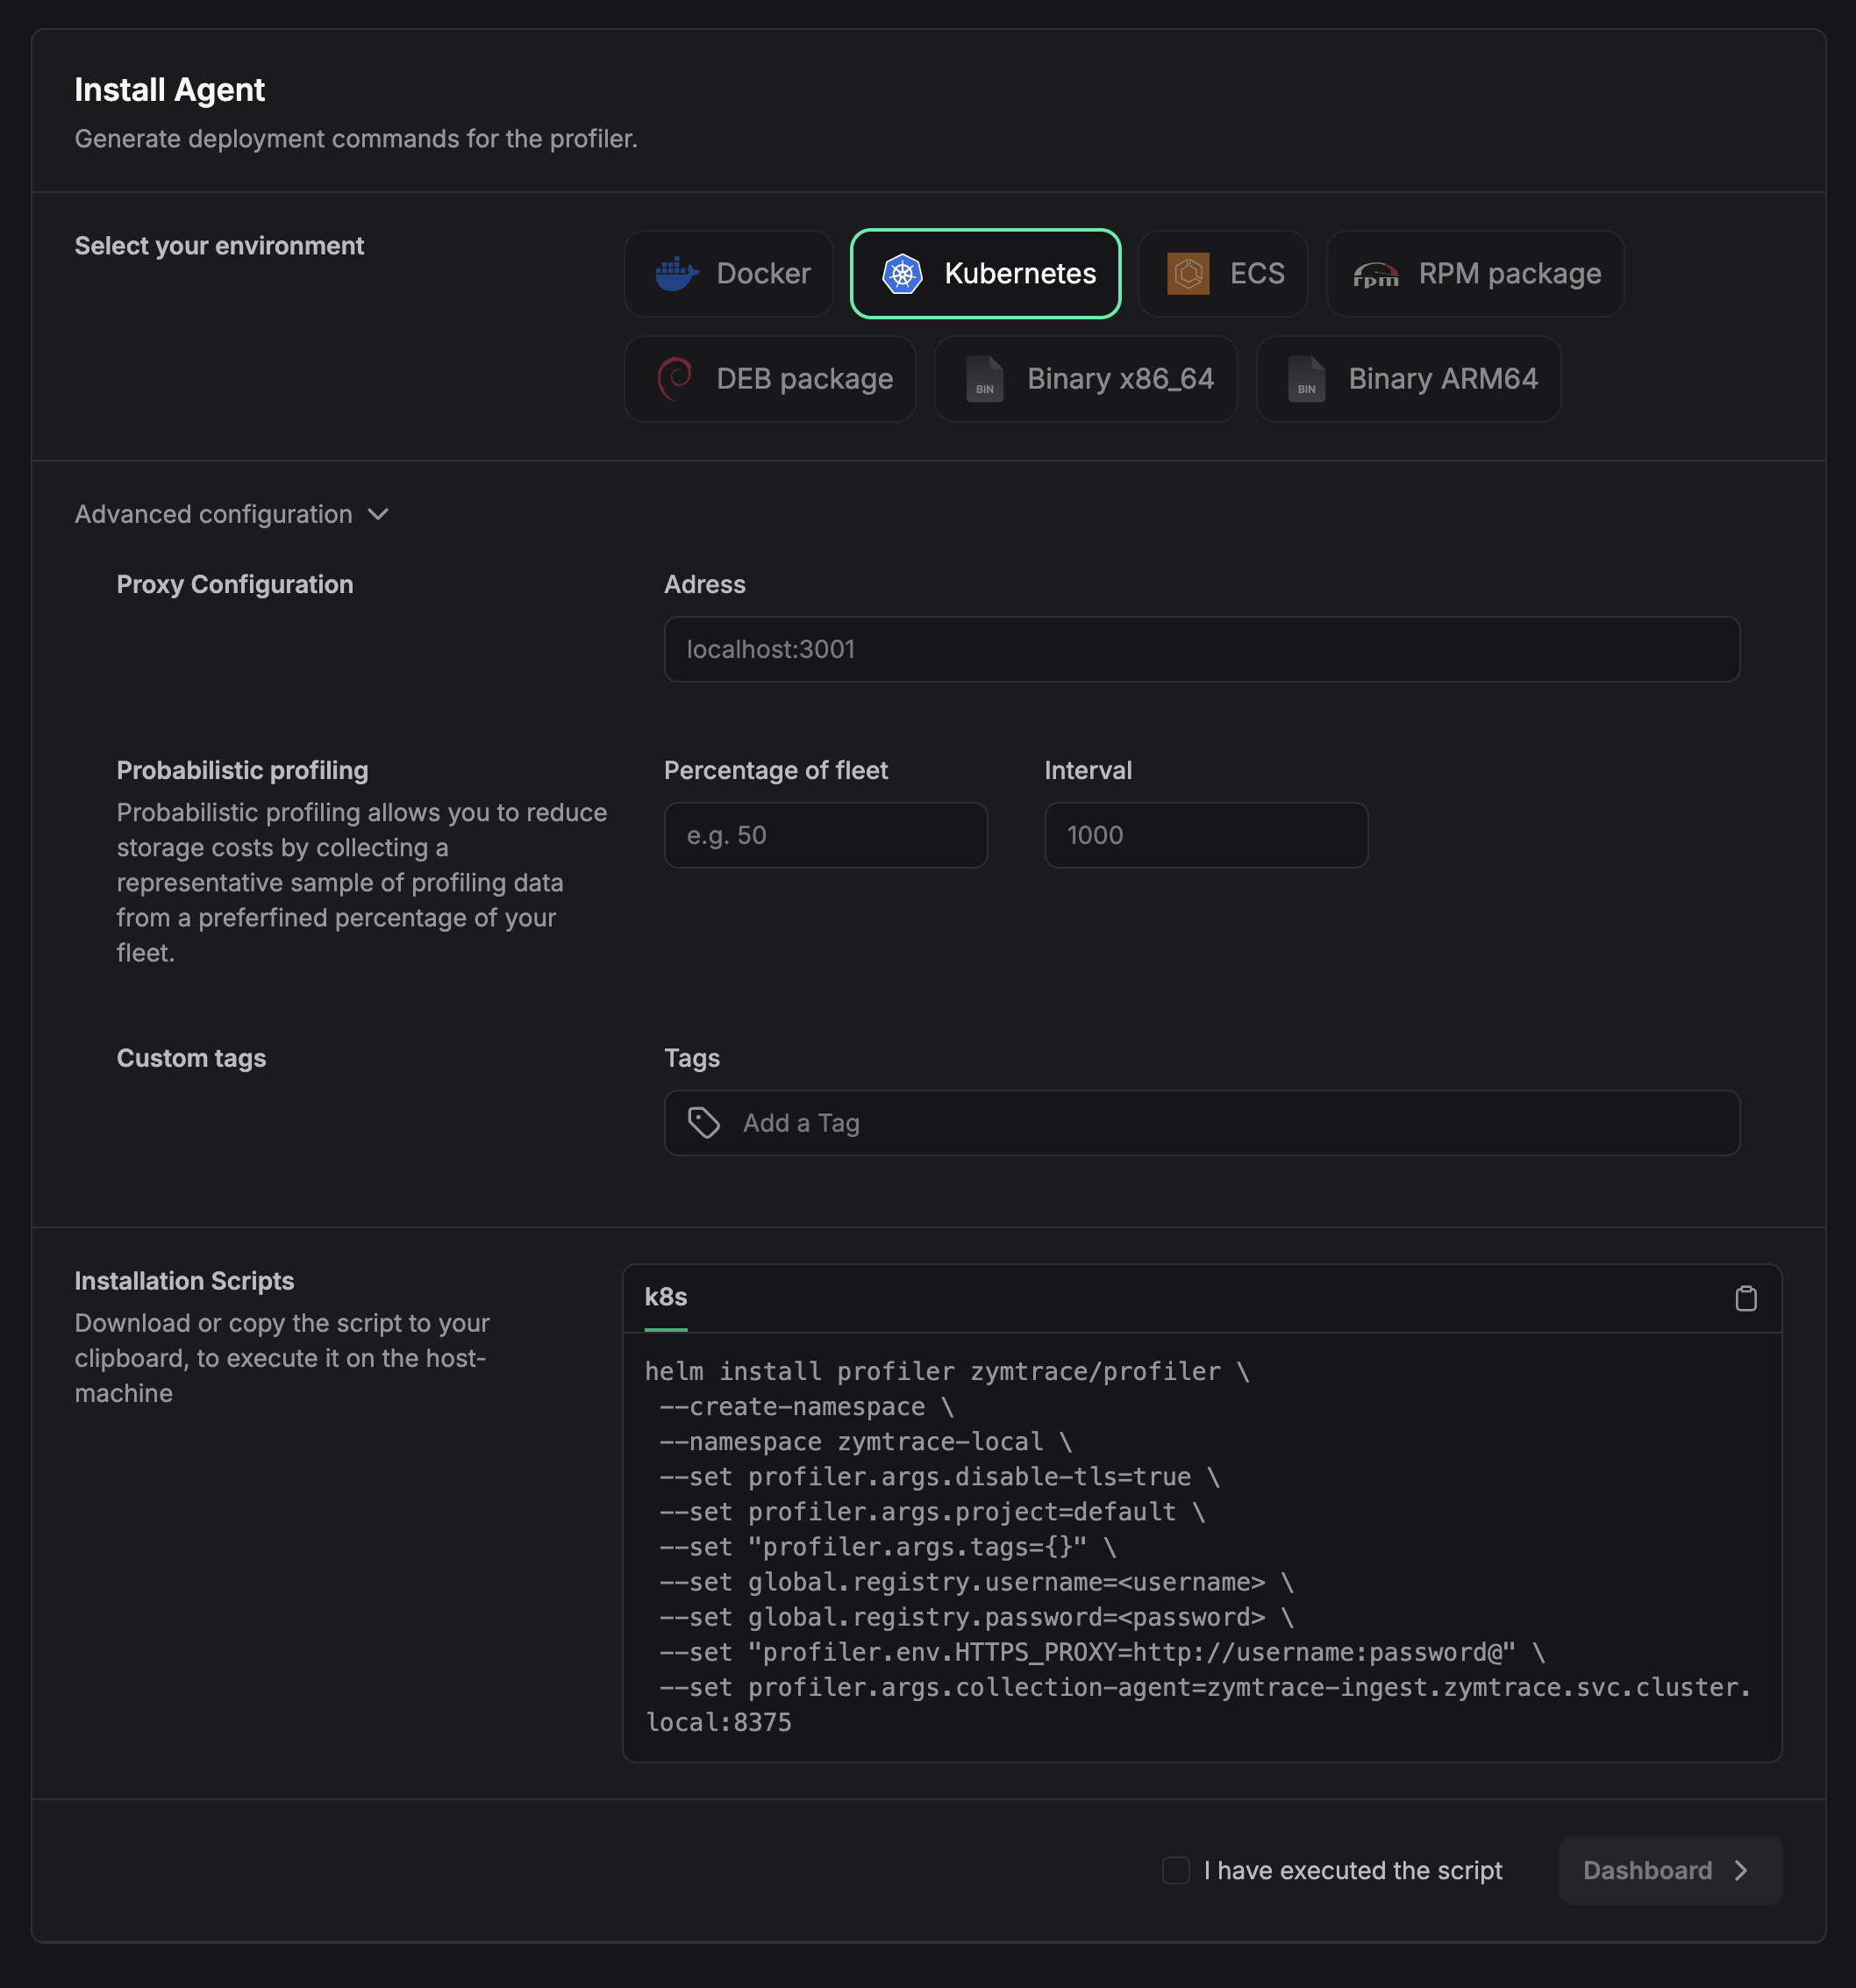
The Add Data page provides a guided approach to generating the deployment commands based on your environment.
Refer to the install profiler page for specifics.

Install
The agent starts reporting data to zymtrace UI in less than 3 minutes. Start optimizing your fleet with Efficiency IQ.