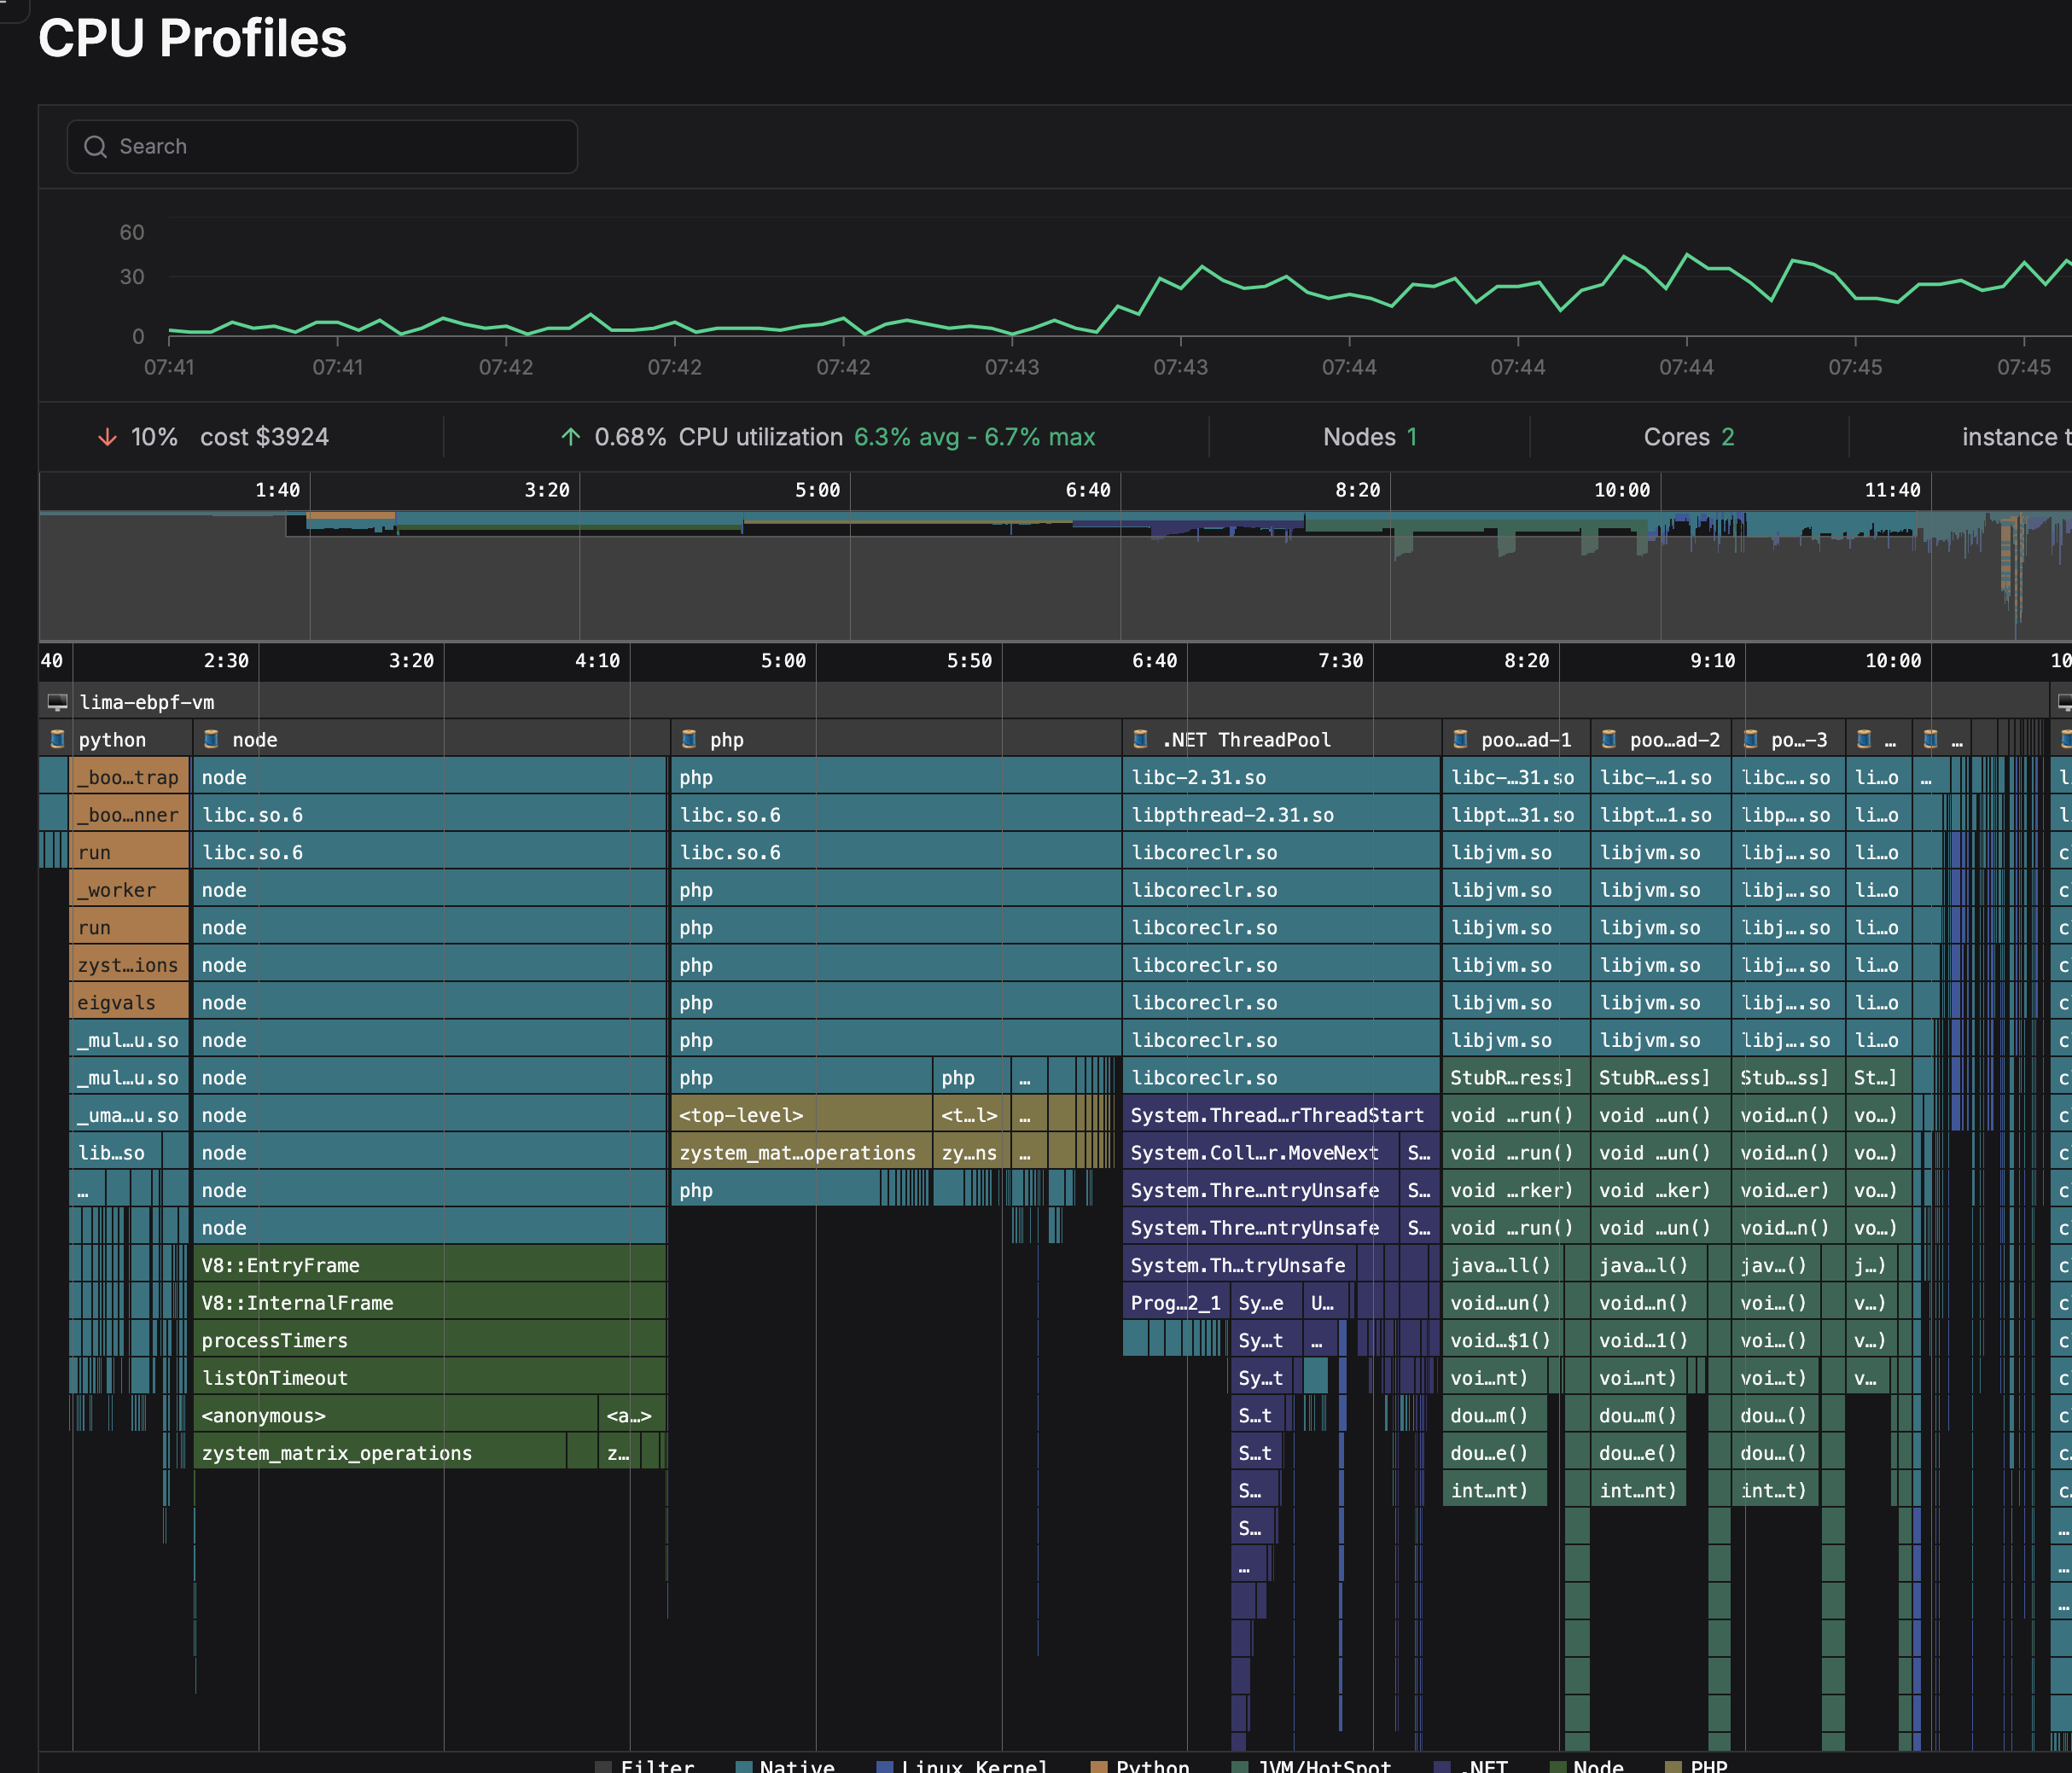
Flamegraphs
Flamegraphs provide a visual representation of call stacks, showing how much time is spent in different functions and their callees.
In zymtrace, stack traces are grouped and displayed as rectangles that are stacked either on top of or next to each other to form the flamegraph. The size of each rectangle represents the relative weight of a child compared to its parent.
zymtrace utilizes icicle graphs, which are an inverted variant of the standard flamegraph. In an icicle graph, the root function is at the top, and its child functions are shown below their parents, making it easier to visualize the hierarchy of functions and understand their relationships.
Note that identical stacks are grouped together, regardless of whether they were recorded sequentially. Then, the stacks are sorted so that the heaviest stack for each parent is on the left, so we recommend that you read from left to right.

Benefits
You can use flame graphs to:
- Detect unexpected system calls or native library usage in your application
- Identify CPU-intensive code paths in applications, revealing performance bottlenecks and optimization opportunities
- Discover deeply nested call stacks, which often indicate excessive indirection between classes or objects
Navigation
The main view is split into two: the top area is the minimap, and the bottom area is the stack view.
Minimap Navigation
- Scroll on either axis to pan around
- Click and drag to narrow your view to a specific range
Stack View Navigation
- Scroll on either axis to pan around
- Pinch to zoom
- Hold Cmd+Scroll to zoom
- Double-click on a frame to fit the viewport to it
- Click on a frame to view summary statistics about it
Keyboard Navigation
- +: zoom in
- -: zoom out
- 0: zoom out to see the entire profile
- w/a/s/d or arrow keys: pan around the profile
- r: Collapse recursion in the flamegraphs
- Cmd+F/Ctrl+F: to open search. While open, Enter and Shift+Enter cycle through results