Inference Server Metrics
zymtrace automatically detects and extracts application-level metrics from popular AI inference servers. These metrics complement GPU metrics and CPU profiles by surfacing serving-layer performance data: throughput, queue depth, latency, cache efficiency, and more — directly alongside your profiling data.
How It Works
The profiler scrapes Prometheus-compatible metrics endpoints exposed by the inference server running on the same host. No changes to the inference server are required. The profiler automatically discovers the endpoint and begins collecting metrics at the interval configured by -collect-metrics-interval (default: 30s).
Collected metrics are forwarded to the zymtrace backend alongside profiles and GPU metrics, making it possible to correlate high token latency or low cache hit rates directly with CPU and GPU profiling data.
Enabling Inference Server Metrics
Each inference server has a dedicated flag. All three are enabled by default, so no extra configuration is needed when the profiler is running alongside a supported server.
| Inference Server | CLI Flag | Environment Variable | Default |
|---|---|---|---|
| vLLM | -enable-vllm-metrics | ZYMTRACE_ENABLE_VLLM_METRICS | true |
| SGLang | -enable-sglang-metrics | ZYMTRACE_ENABLE_SGLANG_METRICS | true |
| NVIDIA Dynamo-Triton | -enable-triton-metrics | ZYMTRACE_ENABLE_TRITON_METRICS | true |
To explicitly disable metrics collection for a specific server, set the flag to false:
# Disable only vLLM metrics
sudo ./zymtrace-profiler \
  -collection-agent=gateway.company.com:443 \
  -enable-vllm-metrics=false
Or via environment variable:
export ZYMTRACE_ENABLE_VLLM_METRICS=false
sudo ./zymtrace-profiler -collection-agent=gateway.company.com:443
Configuration Reference
See the Profiler ENV & CLI Args page for the full list of configuration options, including -collect-metrics-interval which controls how frequently all metrics (GPU, host, and inference server) are scraped.
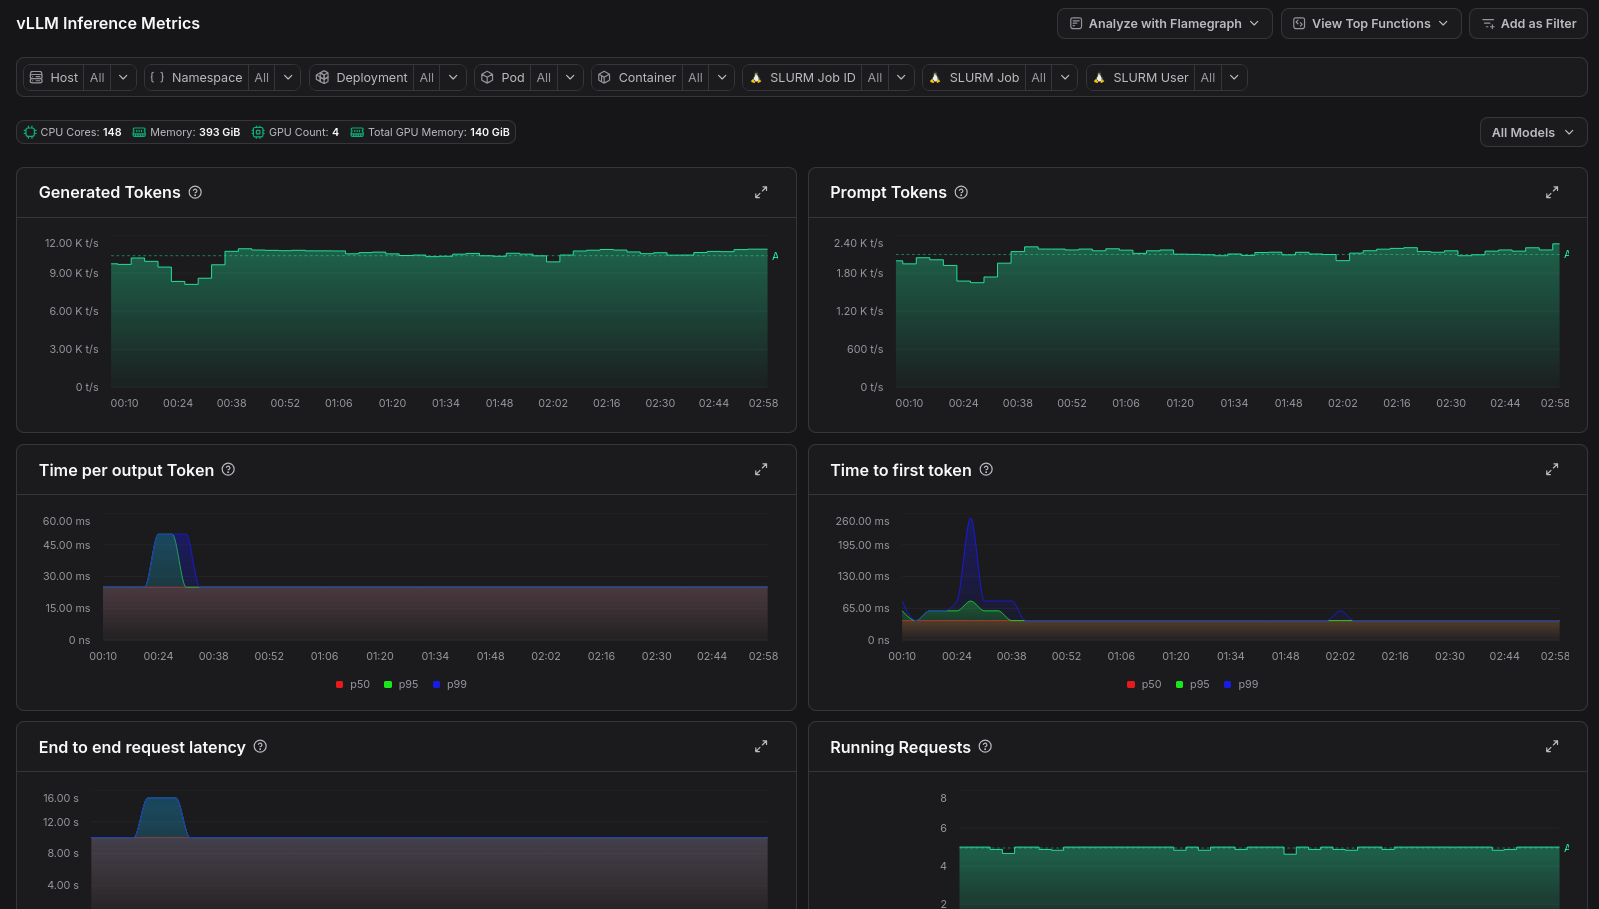
Viewing metrics
To view the inference metrics in zymtrace, expand the Fleet-wide Metrics entry in the sidebar, then select vLLM, SGLang, or Dynamo-Triton.
Digging deeper with profiles
Metrics tell you what is slow, profiles tell you why. When a metric data point looks anomalous, you can jump straight to the GPU flamegraph for that moment in time.
Click any data point on a metric chart and select Analyze with GPU flamegraph from the pop-up menu. zymtrace will open the flamegraph scoped to that exact timestamp, so you can immediately see which CUDA kernels were consuming resources when the metric spiked.