Diff Functions
The Diff Functions View is designed to provide a precise, function-level comparison of compute usage between two distinct states. It helps you measure performance shifts, identifying both improvements and regressions across different releases, A/B tests, or deployments.
What Can You Do With Diff Functions View?
When you change your code or deployment configuration, the Diff View is the fastest way to validate its performance impact. It's perfect for detecting performance regressions that might be hidden when a fix in one area shifts a bottleneck to another.
Popular use-cases include:
-
Compare Releases: Instantly see resource consumption differences between two versions of your application (e.g.,
v1vs.v2). -
A/B Testing: Quantify the resource cost of a new feature by comparing performance between test groups (
Controlvs.Experiment). -
Blue/Green Deployments: Track performance shifts when switching traffic between environments to ensure the new deployment is stable and efficient.
-
Code Change Validation: Measure the exact impact of a specific commit, library update, or configuration change.
 Diff Functions
How to Use the Diff Functions View
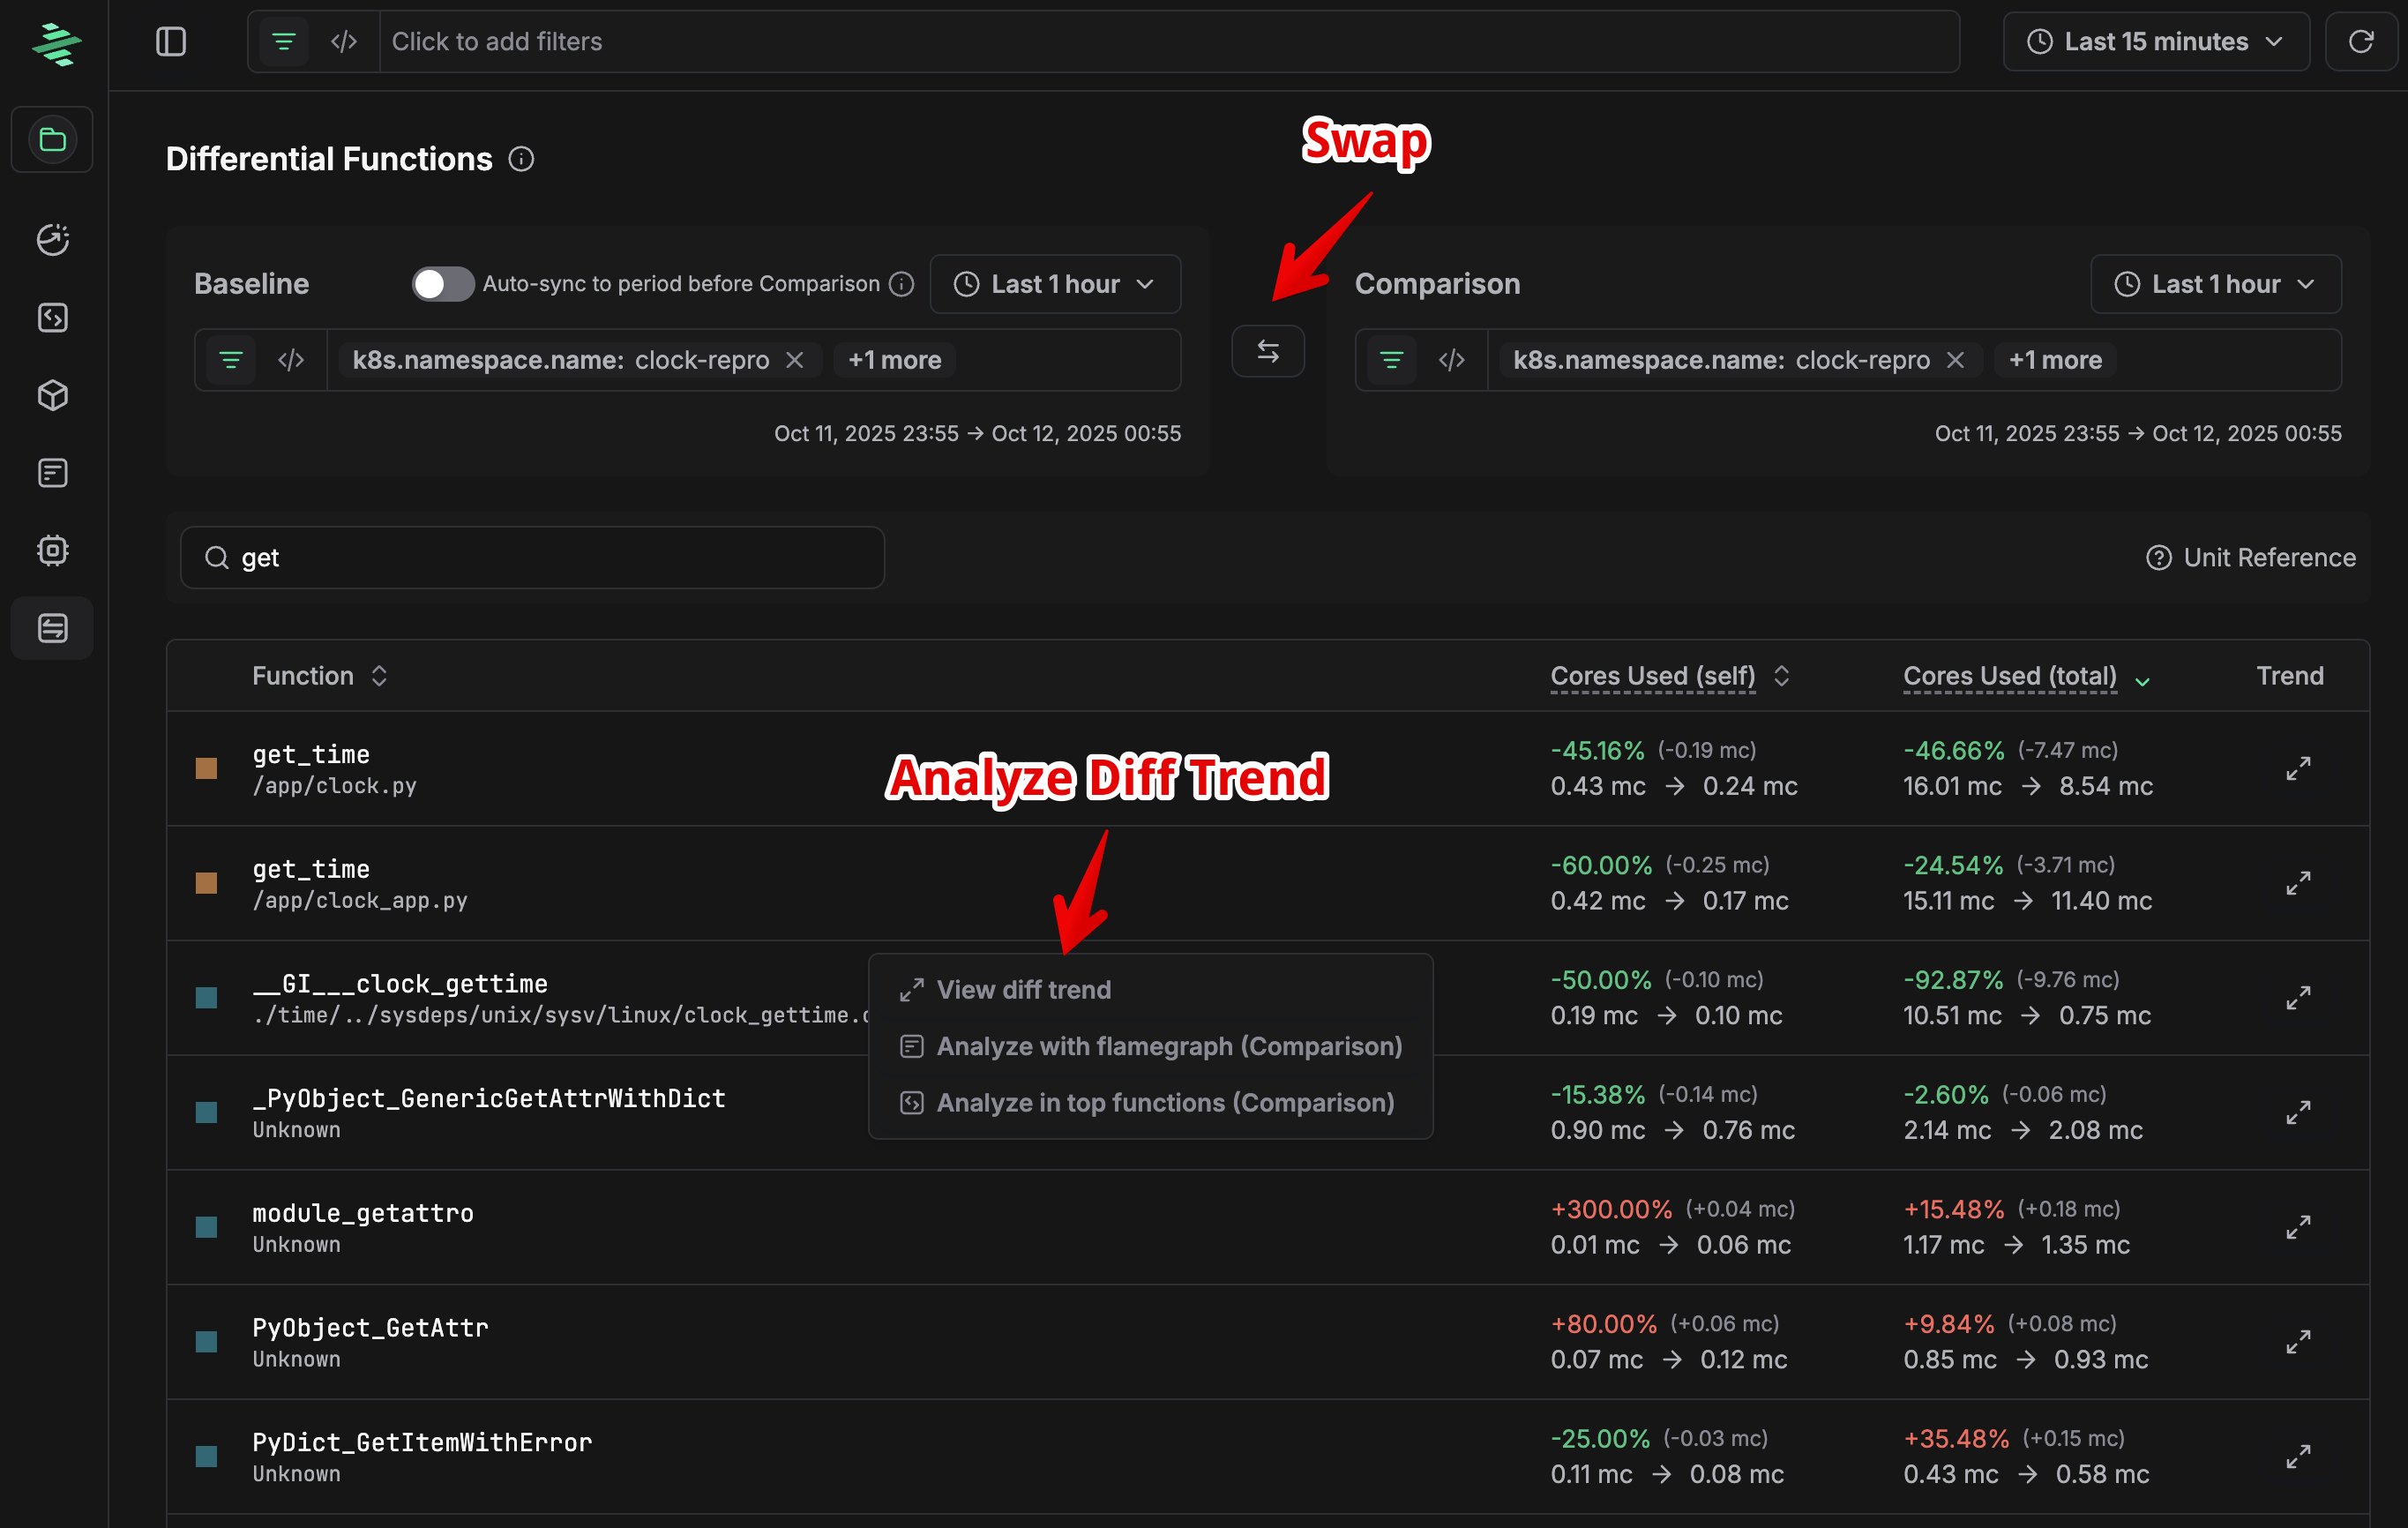
The view operates by defining a Baseline and a Comparison scope, presenting the difference in resource usage function by function.
- Define Scopes:
- Baseline: Use the left selector (e.g.,
container.name: clock-slowandLast 1 Hour) to define the initial state, typically the "before" or older version. - Comparison: Use the right selector (e.g.,
container.name: clock-fastandLast 1 Hour) to define the new state, typically the "after" or current version. - Tip: You can compare time ranges (e.g., "Yesterday" vs. "Today"), or a combination of time and filterable entities (e.g., two different containers, like in the screenshot).
- Baseline: Use the left selector (e.g.,
- Analyze the Table: The table lists all functions whose resource usage changed between the Baseline and the Comparison.
- Search and Filter: Use the
getsearch bar to find a specific function or file path (e.g., search for a utility function or a known component). - Drill Down: Click any function to see detailed metrics, flame graphs, and historical trends for that specific function in both the Baseline and Comparison scopes.
- Search and Filter: Use the
Understanding the Data Columns
The table focuses on the change in "Cores Used" to measure resource consumption, showing both the absolute and percentage change.
| Column | Description |
|---|---|
| Function | The name of the function or file path where the resource usage occurred. |
| Cores Used (self) | The difference in CPU time spent directly inside this function, excluding its children. |
| Cores Used (total) | The difference in CPU time spent in this function and all its children (the entire sub-tree of calls). This is usually the best metric for total impact. |
| Trend | A link to the historical trend view for the function, allowing you to see the change over a longer timeline. |
Interpreting the Color Codes
The color of the percentage change indicates the nature of the performance shift:
| Color | Meaning | Description |
|---|---|---|
| Green | Improvement (Negative Change) | Indicates a reduction in resource usage (e.g., CPU consumption is lower). These are positive changes, showing the function is more efficient in the Comparison scope. |
| Red | Regression (Positive Change) | Indicates an increase in resource usage. These are negative changes, showing the function is consuming more resources. Investigate these entries. |
| Purple | New/Added | Marks functions that appeared in the Comparison scope but did not exist in the Baseline. |
| Removed | Removed | Marks functions that existed in the Baseline but are no longer present in the Comparison scope, meaning the function was completely removed in the comparison and its baseline usage is now gone/shifted). |
| Unchanged | No Significant Change | Functions with no significant change in resource usage are hidden by default, but can be displayed if filtering is applied. |
Drilling Down to the Trend (Diff Trend Analysis)
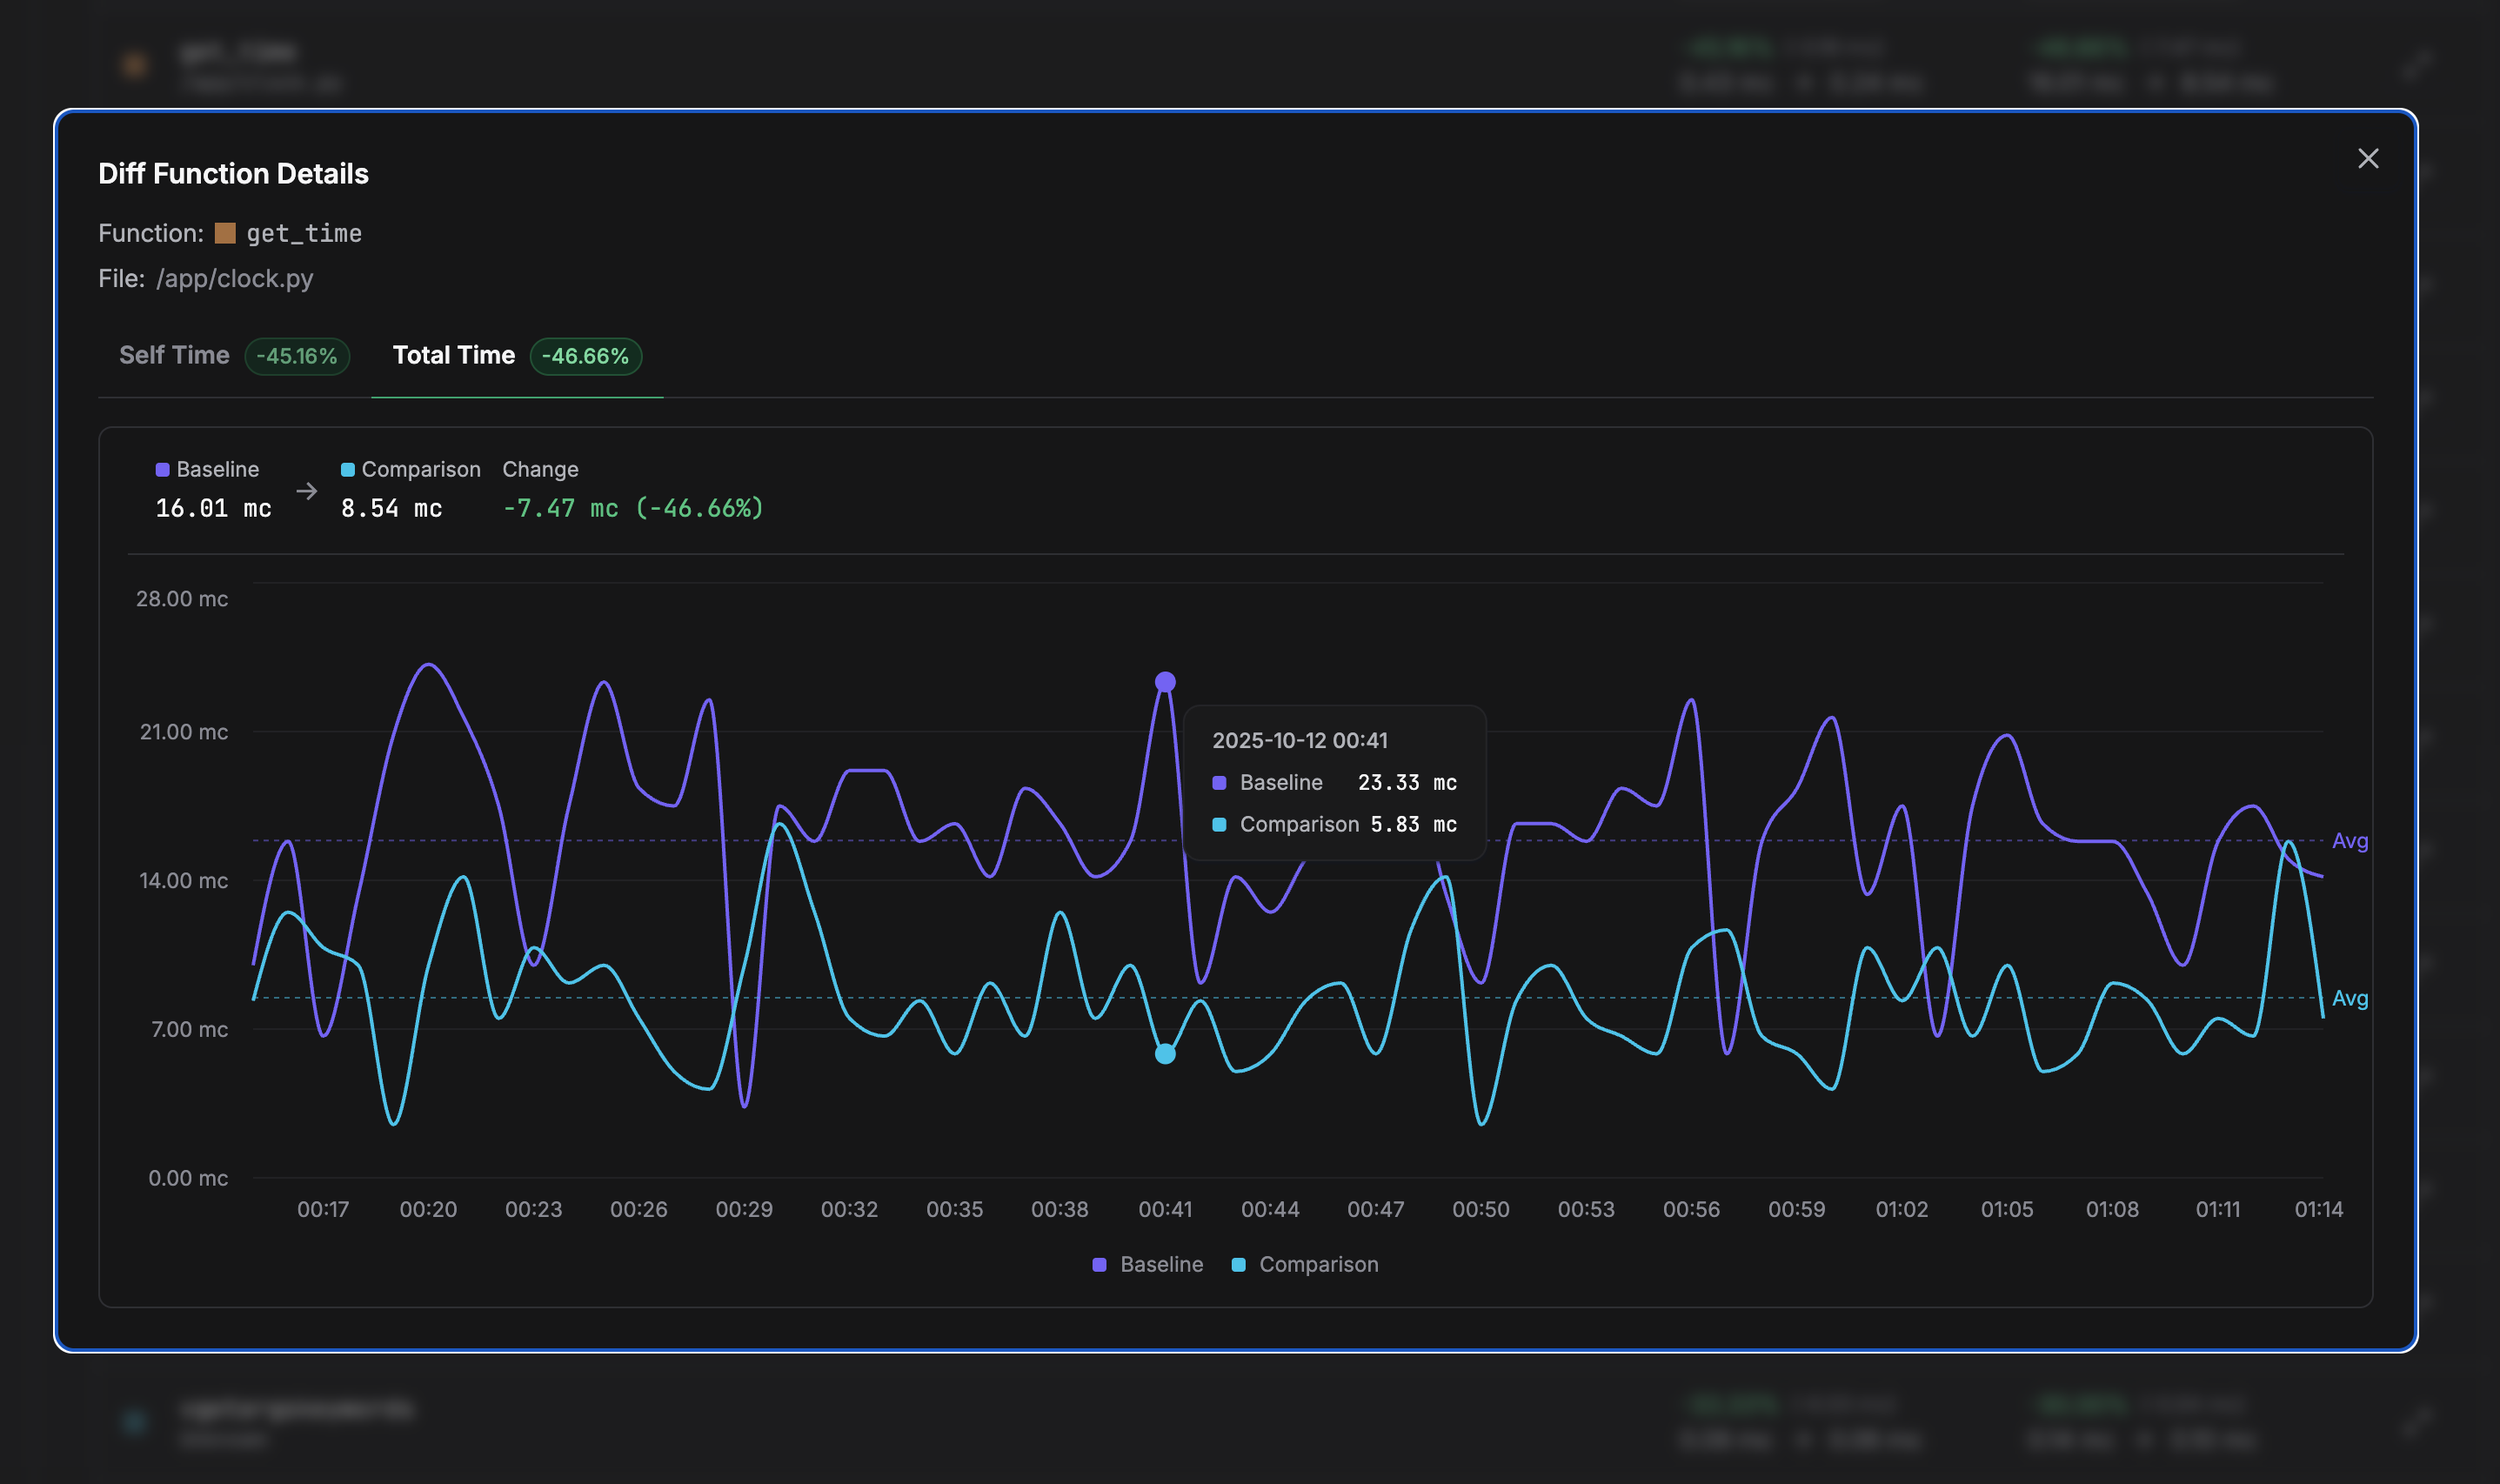
Clicking a function opens the Diff Function Trend panel, which provides a time-series comparison of the function's resource consumption across the selected Baseline and Comparison time ranges.
 Diff Functions Trend Analysis
Key Data Points
- Function and File: Clearly identifies the function (e.g.,
get_time) and its location (/app/clock.py). - Total Time / Self Time: Displays the overall percentage change for both the time spent in the function and its children (Total Time), and the time spent only in the function itself (Self Time).
- Absolute Change: Provides the resource consumption averages for both scopes and the absolute difference.
- Baseline: The average usage for the Baseline period (e.g., 16.01 mc).
- Comparison: The average usage for the Comparison period (e.g., 8.54 mc).
- Change: The absolute difference (e.g., -7.47 mc) and percentage change (e.g., -46.66%).
This visualization allows you to confirm if the observed performance shift is consistent throughout the entire period or if it's the result of a few large spikes. It also provides a clear visual confirmation of the magnitude of the improvement or regression.