Top Functions
The Top Functions view presents an ordered list of functions that zymtrace samples most often. From this view, you can spot the most expensive functions across your entire fleet, applying filters to drill down into individual components.
Click any function to open the Sandwich view, which shows the function's callers (what called it) and callees (what it called), giving you the complete execution context to understand and optimize your code.
We strongly recommend you add frame type filters in combination with the entity of your choice to narrow down your search. For example, combine k8s.pod.name == "my-app" with profile.frame.type == "python" to focus on Python functions in a specific pod.
- GPU Top Functions
- CPU Top Functions
GPU Top Functions
GOU functions are ranked by how much GPU time they have taken, helping you identify:
- CPU-side optimization opportunities - GPU time enqueued by CPU code to determine where to optimize on the CPU side
- Slow CUDA kernel executions - Identify kernels that are executing inefficiently on the GPU
- Kernel fusion opportunities - Find where multiple kernel launches can be combined for better performance
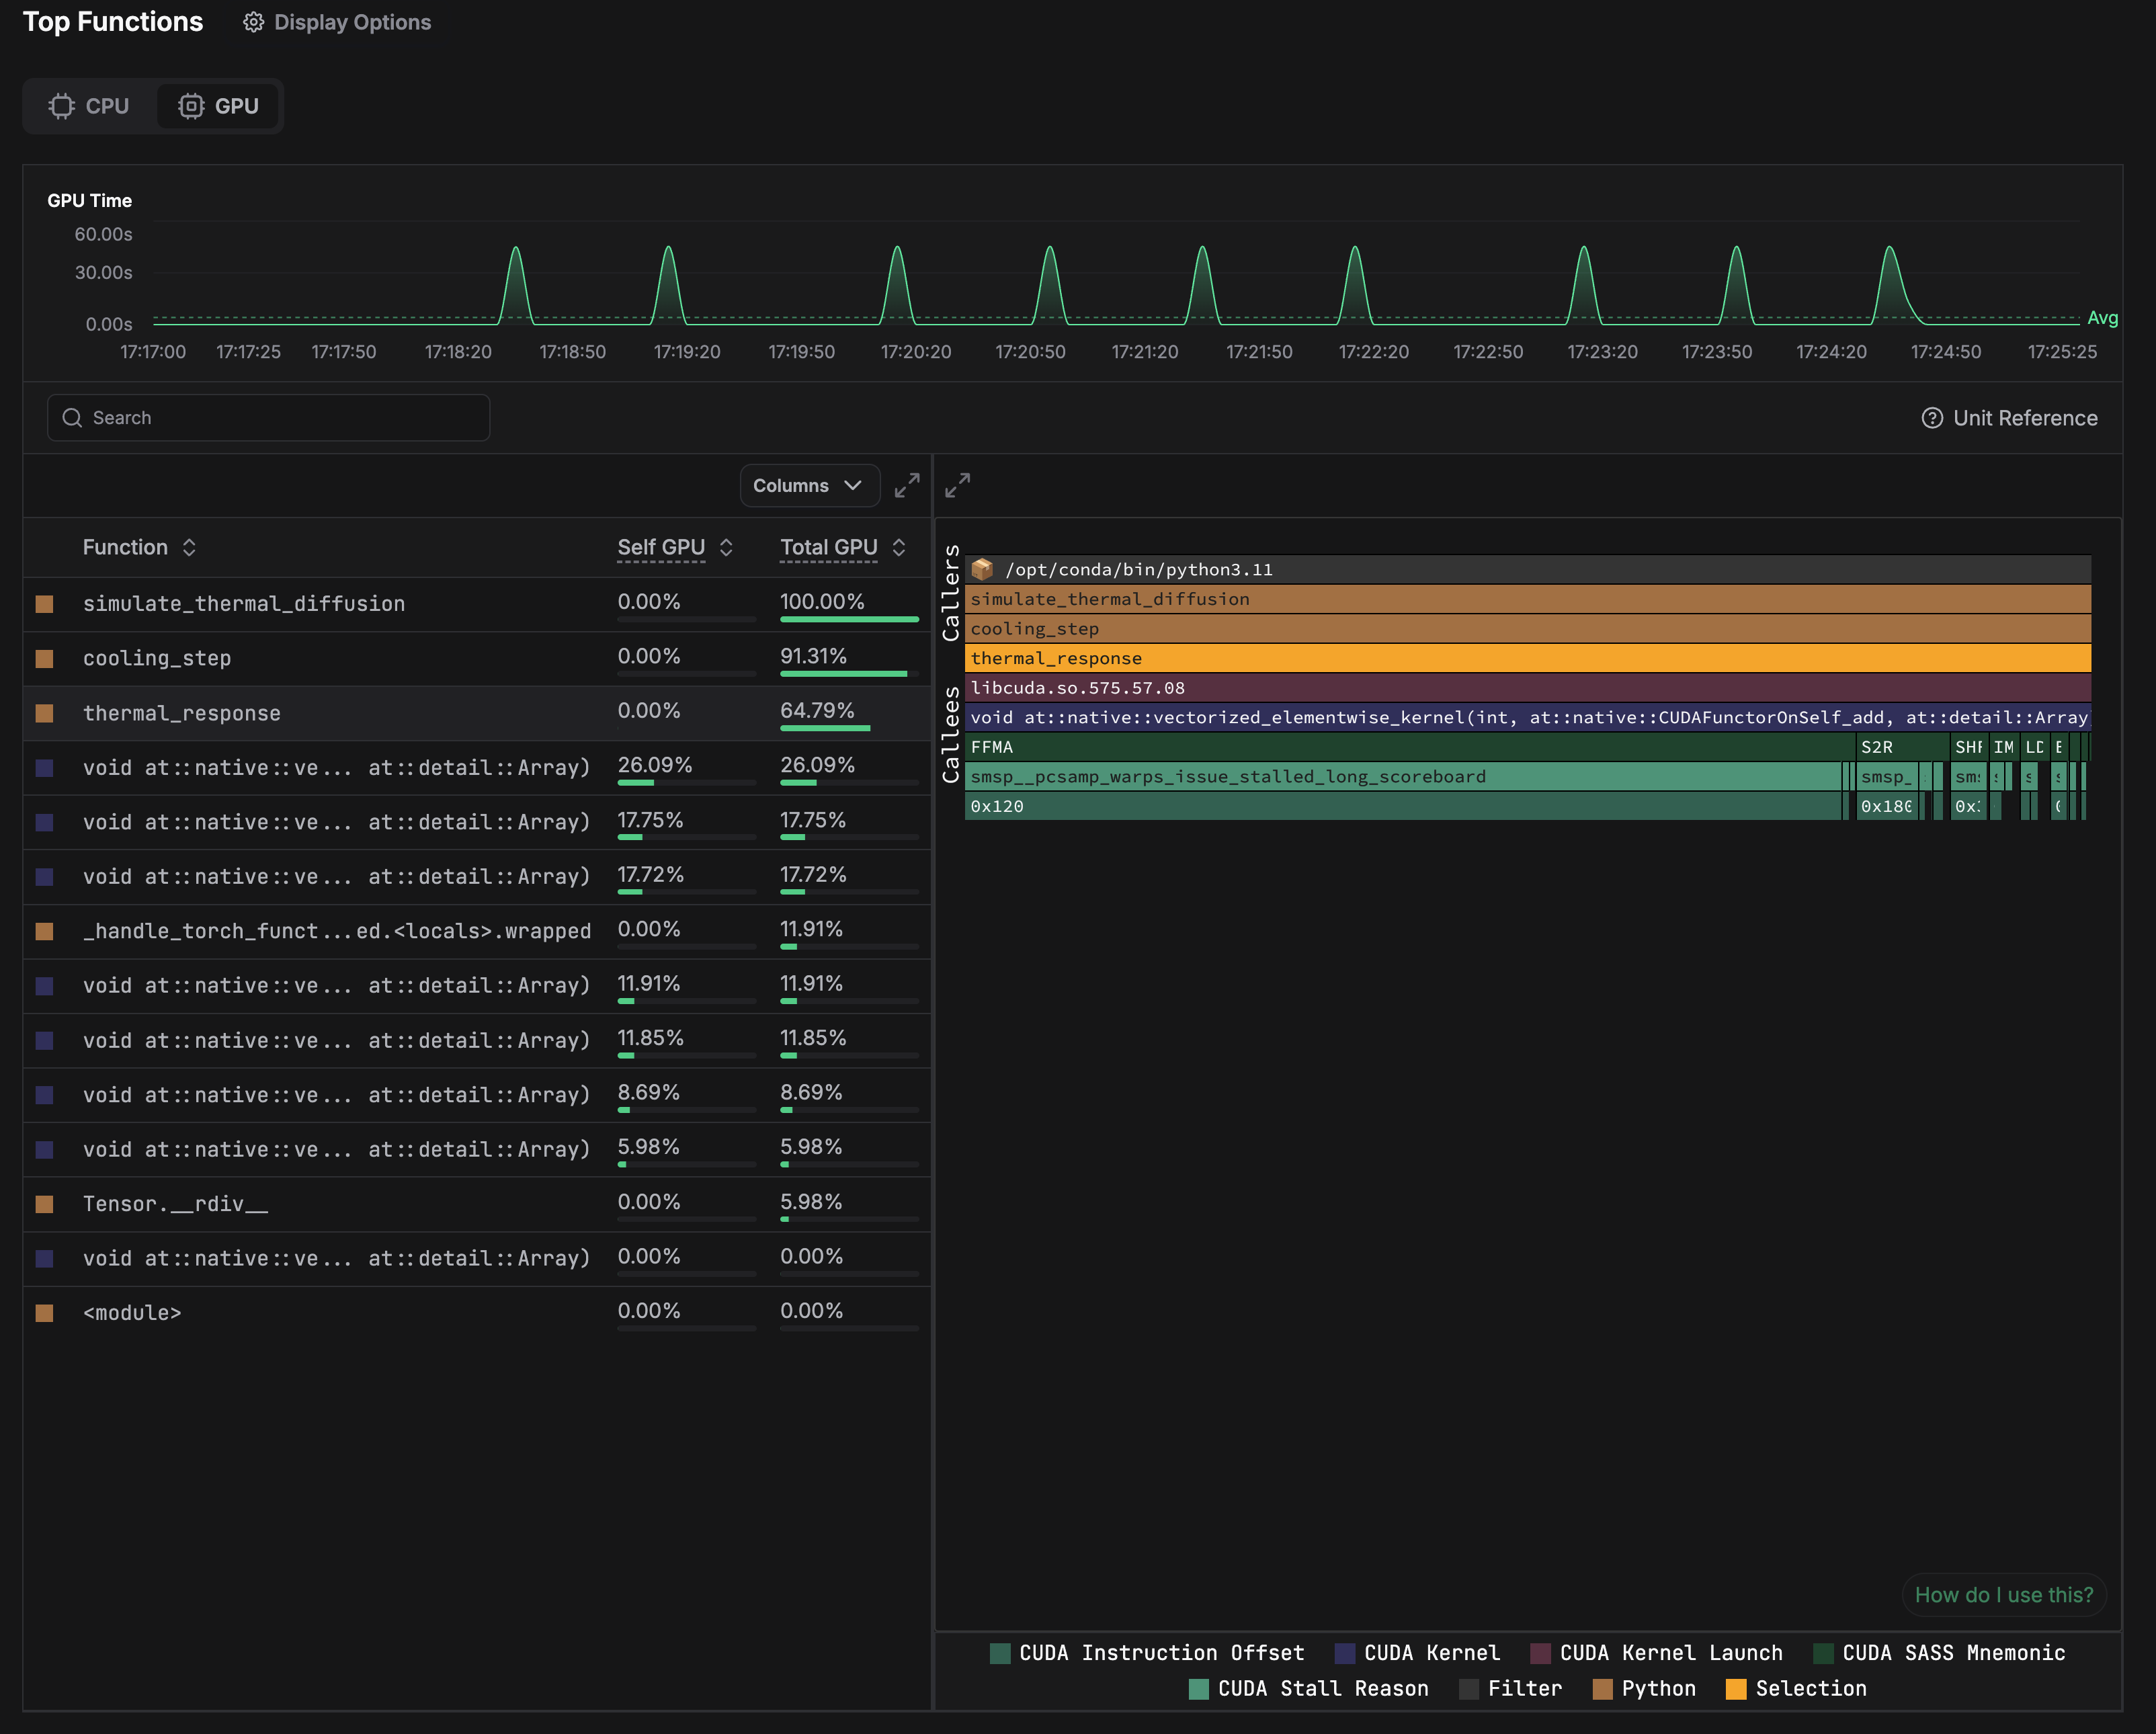 GPU Top Functions showing GPU consumption across services
Understanding the Data
The table below shows the profiling data displayed for each function:
| Field | Description |
|---|---|
| Self Time | For CUDA frames, Self Time reflects the time spent executing this particular function on the GPU, excluding any functions it called. For CPython and Native frames this is always zero because they are not actually executed on the GPU. |
| Total Time | For CPython and native frames, Total Time indicates the GPU time consumed by CUDA kernels launched by the function (including its callees); for CUDA frames, it reflects time spent executing the function's body and any functions it called on the GPU. |
| Self GPU % | For CUDA frames, Self GPU reflects the percentage of time spent executing this particular function on the GPU, excluding any functions it called. For CPython and Native frames this is always zero because they are not actually executed on the GPU. |
| Total GPU % | For CPython and native frames, Total GPU indicates the percentage of GPU time consumed by CUDA kernels launched by the function (including its callees); for CUDA frames, it reflects percentage of time spent executing the function's body and any functions it called on the GPU. |
The data above varies based on the frame type:
- CUDA frames: Represent actual GPU kernel execution
- CPython/Native frames: Represent CPU code that launches GPU kernels
Learn more about this data in the Unit Reference.
CPU Top Functions
Functions are ranked by how frequently they appear in CPU profiling samples, helping you identify:
- Performance hotspots - Functions consuming the most CPU time
- Optimization targets - Where improvements will have the biggest impact
- Resource distribution - How CPU time is spread across your codebase
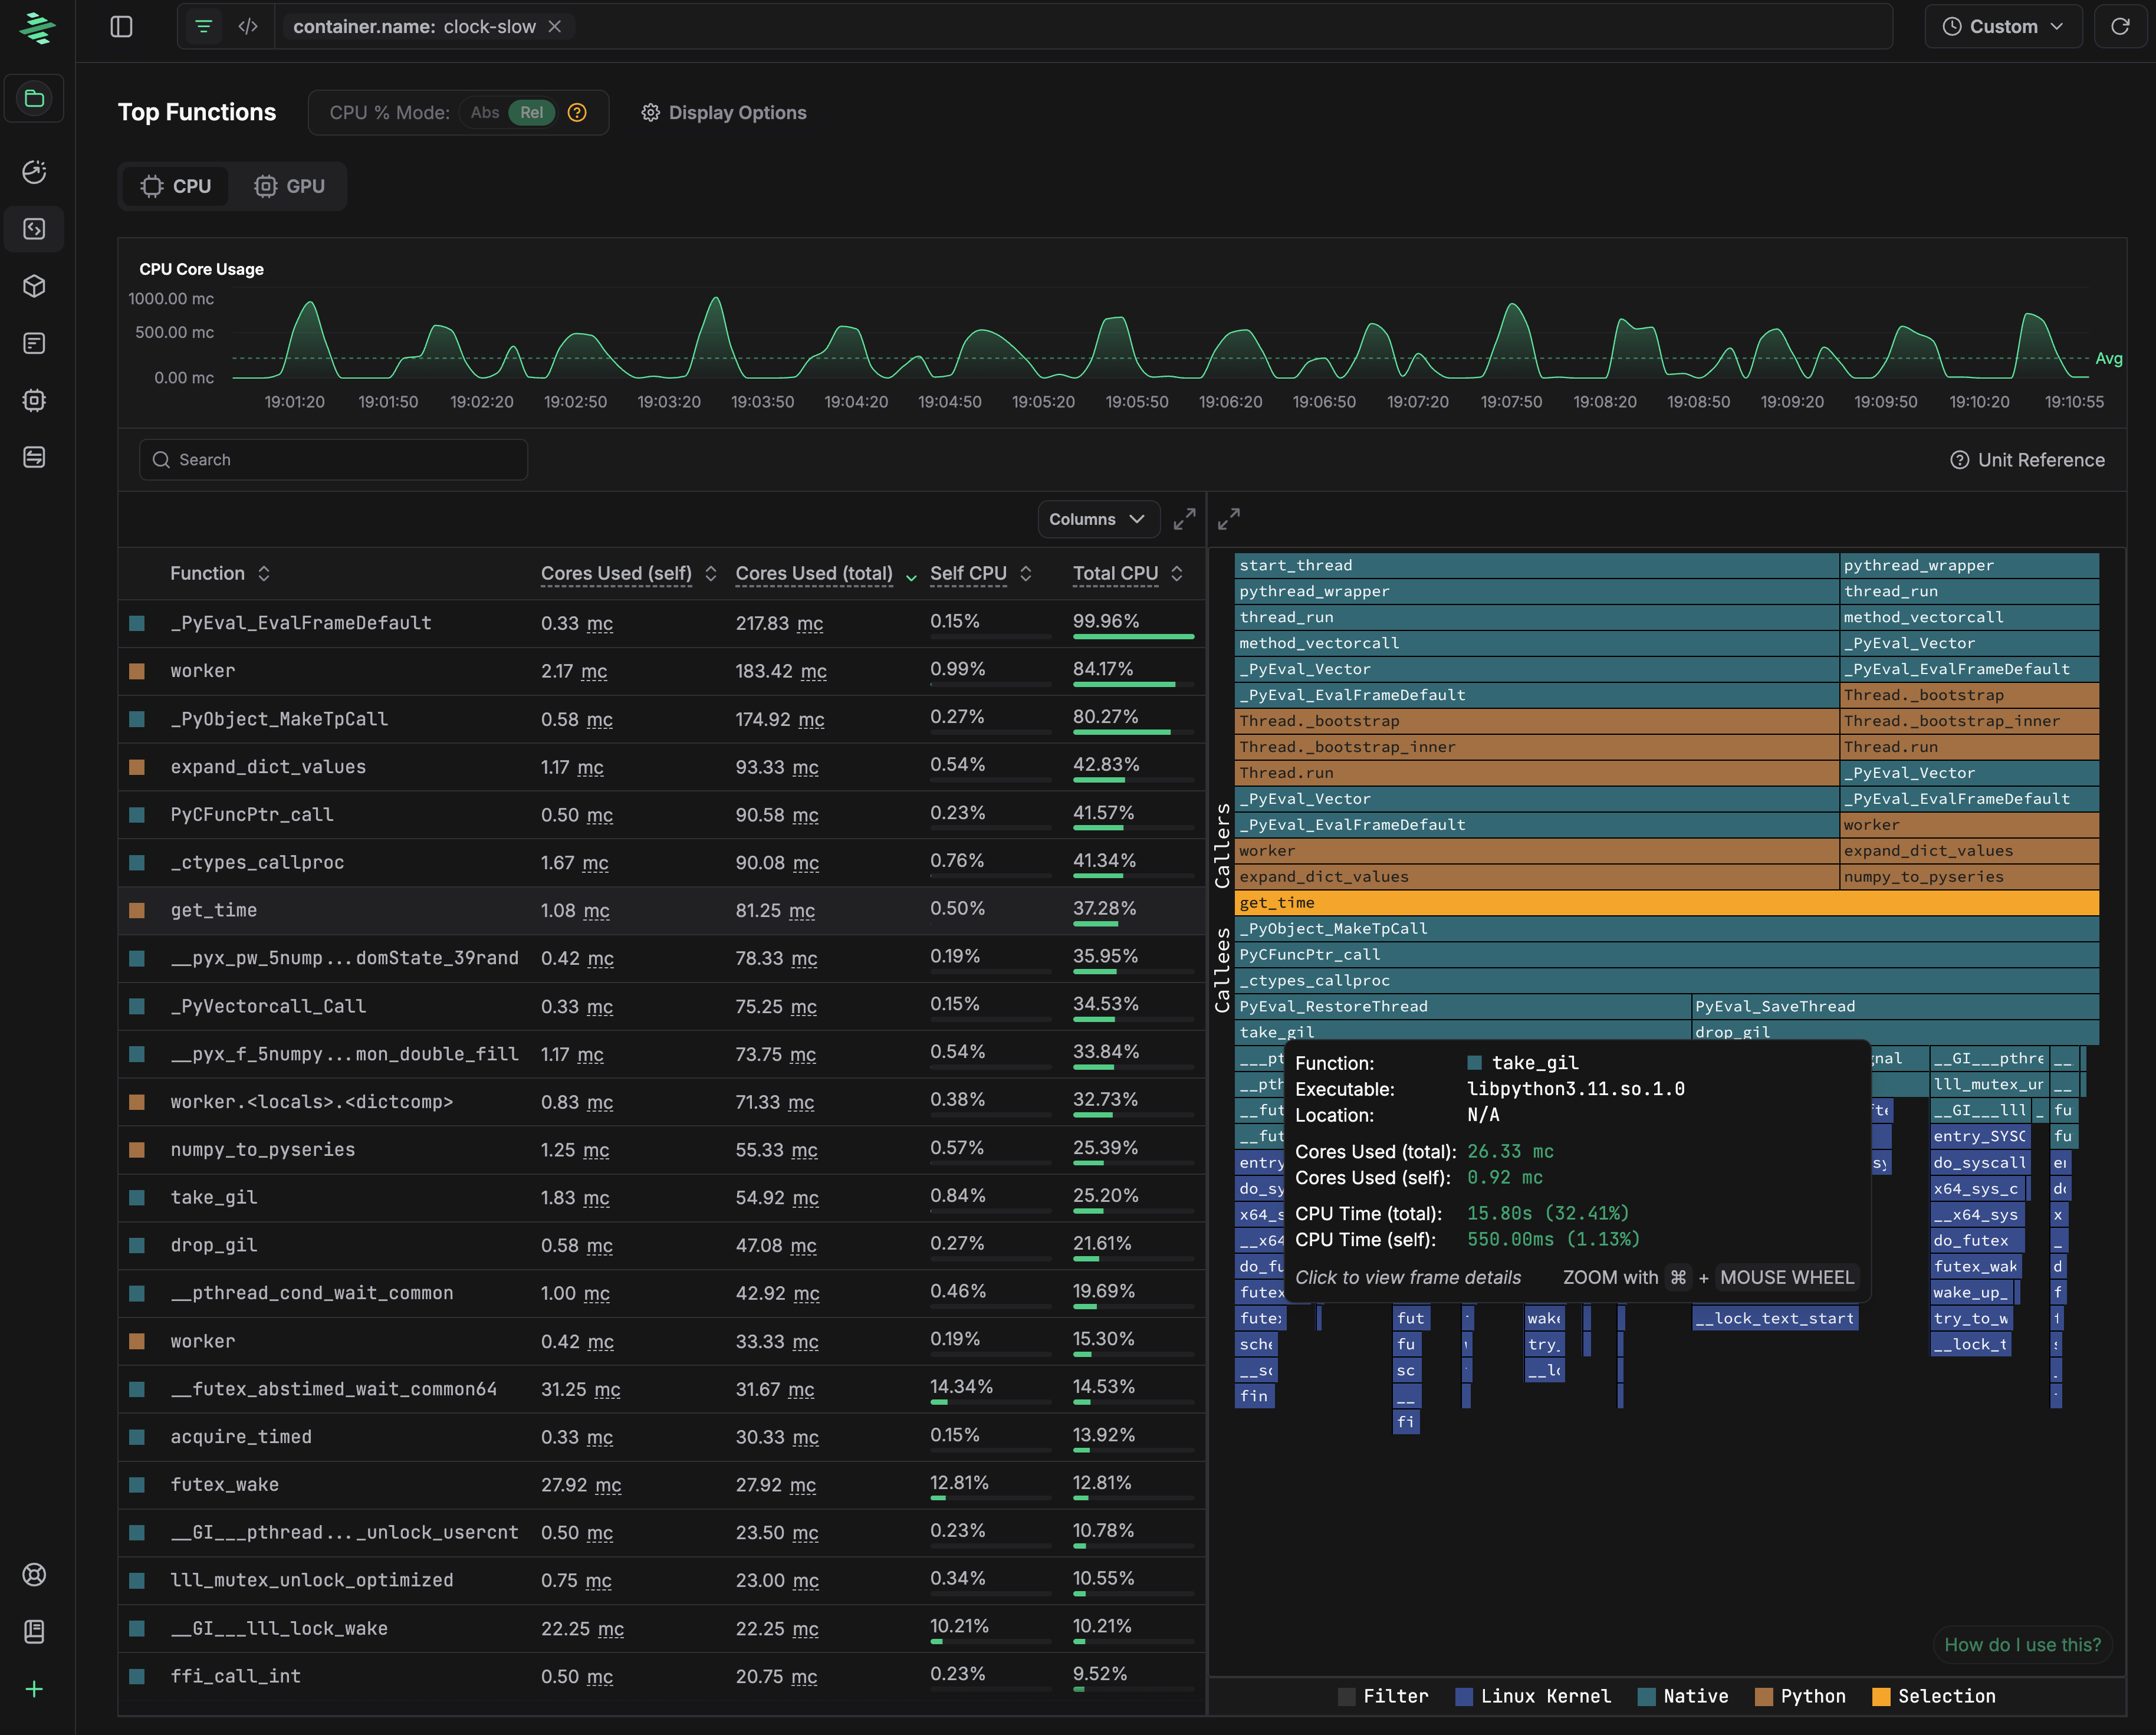 CPU Top Functions showing CPU consumption across services
Understanding the Data
The table below shows the profiling data displayed for each function:
| Field | Description |
|---|---|
| Cores Used (self) | Indicates the amount of CPU cores used per second (on average) in the function's body, excluding the cores used in any functions it called. |
| Cores Used (total) | Indicates the amount of CPU cores used per second (on average) in the function's body, including the cores used in any functions it called. |
| Self CPU % | Indicates the percentage of CPU time spent in the function's body, excluding the time spent in any functions it called. |
| Total CPU % | Indicates the percentage of CPU time spent in the function's body, including the time spent in any functions it called. |
Learn more about this data in the Unit Reference.
Filters help you drill down from infrastructure-wide view to specific components.
Sandwich View
The typical flamegraph will break down resource utilization by function, but it can be difficult to see how much time is spent in the function itself vs how much time is spent in the functions it calls. Sandwich view solves this problem by splitting a flamegraph into two sections:
When you click on any function, zymtrace displays a sandwich view showing the complete call context:
- Callers - The functions that called the function in question (its "parents")
- Selected Function (middle, highlighted) - The function you clicked
- Callees - The functions that the function in question called (its "children")
This view helps you understand the complete execution path and identify optimization opportunities by seeing what calls your expensive function and what it calls in return.