Top Entities
The Top Entities view is your strategic starting point for continuous profiling. It provides a macro-level overview of performance data, grouped by infrastructure components across your entire system. This is your primary tool for understanding resource distribution and quickly identifying which part of your infrastructure is consuming the most compute.
When to Use Top Entities?
This view allows you to answer high-level questions about resource consumption before diving into specific code optimization.
| Question | Value of Top Entities View |
|---|---|
| "Which component is the bottleneck?" | Pinpoint Resource Hogs: Instantly see which Host, Namespace, or Pod is consuming the highest percentage of CPU or GPU resources. |
| "How are resources allocated across my apps?" | Validate Infrastructure Decisions: Quickly confirm if your resource budgeting and horizontal scaling are working as expected across your entire fleet. |
| "Where should I start optimizing?" | Prioritize Effort: Drill down directly from the most resource-intensive entity to its Top Functions to find the exact code consuming the resources. |
| "Which process is the root cause?" | Process-Level Analysis: Use the Main Executables view to track resource consumption by language runtime or process name, regardless of where they run. |
What is an Entity?
An entity in observability refers to any distinct object or component in your system that produces telemetry (profiles, metrics, logs, traces, or events) and can be observed, monitored, and analyzed.
In zymtrace, entities are organized to provide both infrastructure and application context:
- Hosts – Physical or virtual machines running your workloads
- Namespaces – Kubernetes namespaces organizing your resources
- Pods – Kubernetes pods running your containers
- Deployments – Kubernetes deployments managing your applications
- Containers – Individual containers running your code
- Main Executables – The primary process executable
Click any entity to drill down into its Top Functions or CPU/GPU flamegraphs, allowing you to move from infrastructure-level analysis to function-level optimization.
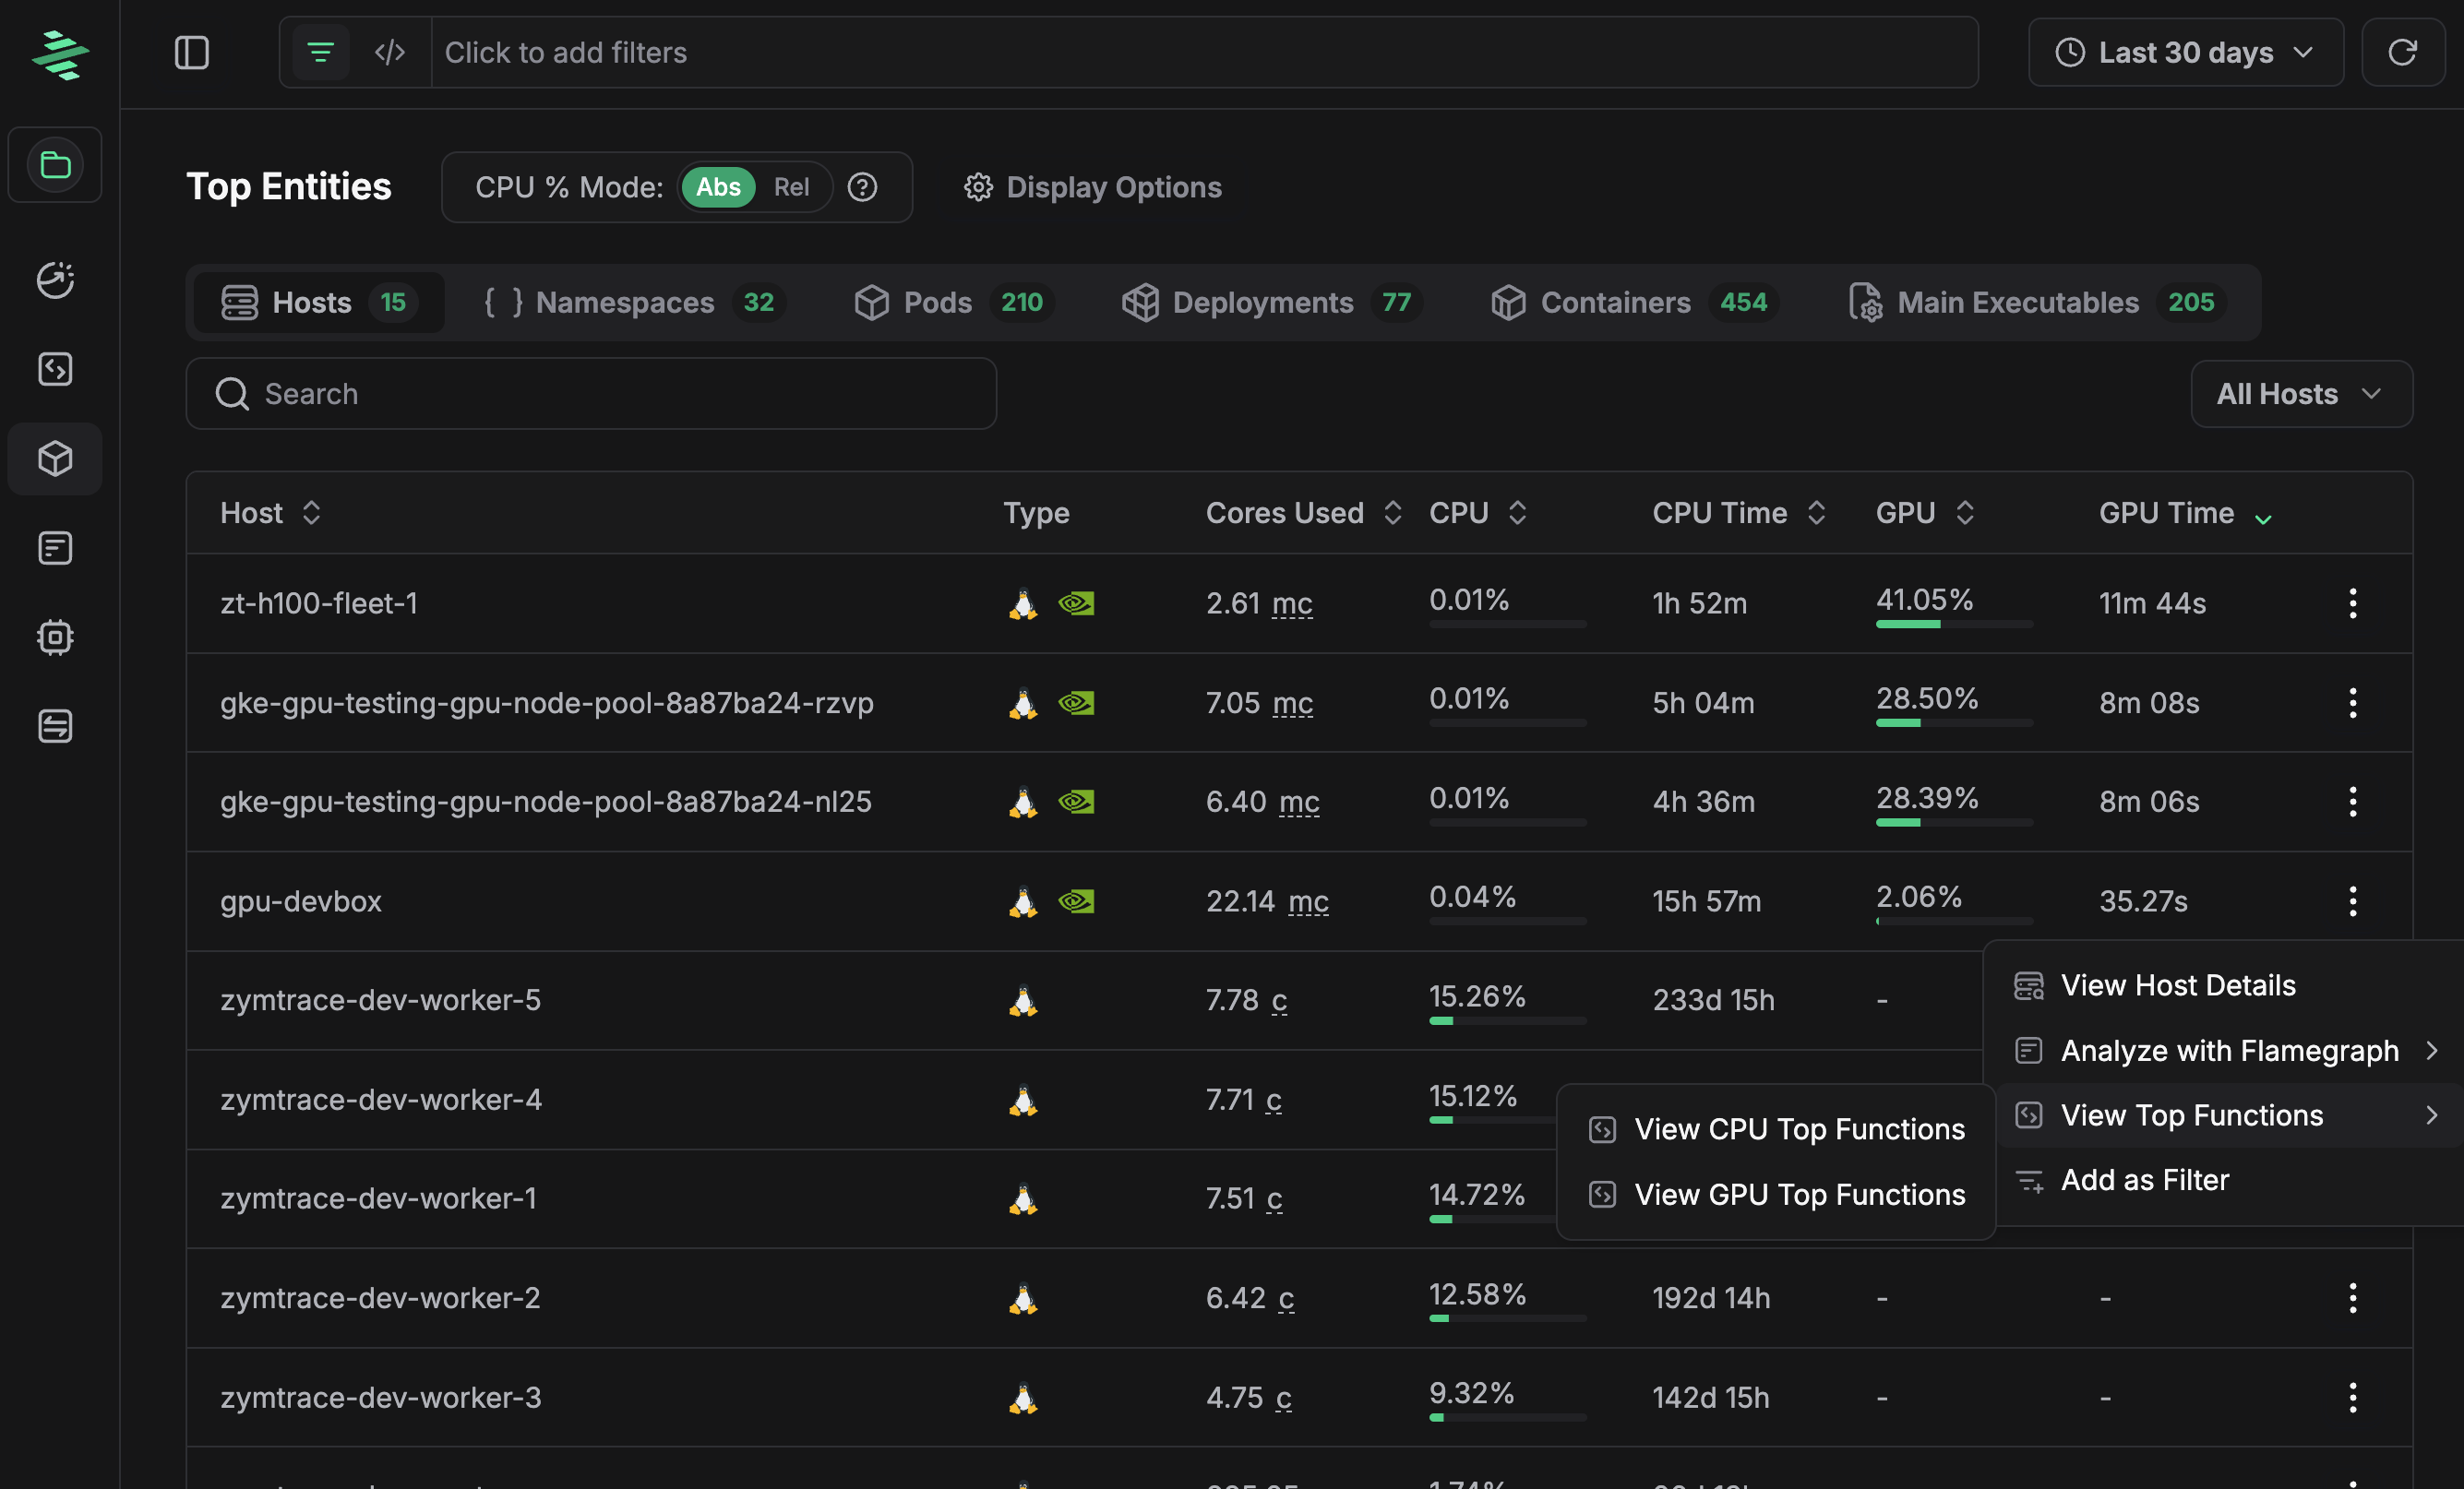 Top Entities
Entity Types
Top Entities can be viewed across different groupings to help you understand resource consumption across your infrastructure.
From a Top Entity page, you can navigate directly to the details page for that entity type, which displays key monitoring metrics. These metrics are collected using eBPF with minimal performance overhead.
Depending on the entity type, you can also access CPU and GPU flamegraphs, as well as top functions, for example, GPU machines will include GPU-specific insights.
Let's look at the detailed monitoring page for some of the entities.
Note each metric point is interactable, you can either click to expand it or navigate to corresponding profiles for the given data point.
Hosts
Most entity types provide similar views with consistent metrics across your infrastructure. Below is an example of the detailed monitoring page for Hosts.
Host Detailed View
- Host Metrics
- GPU Metrics
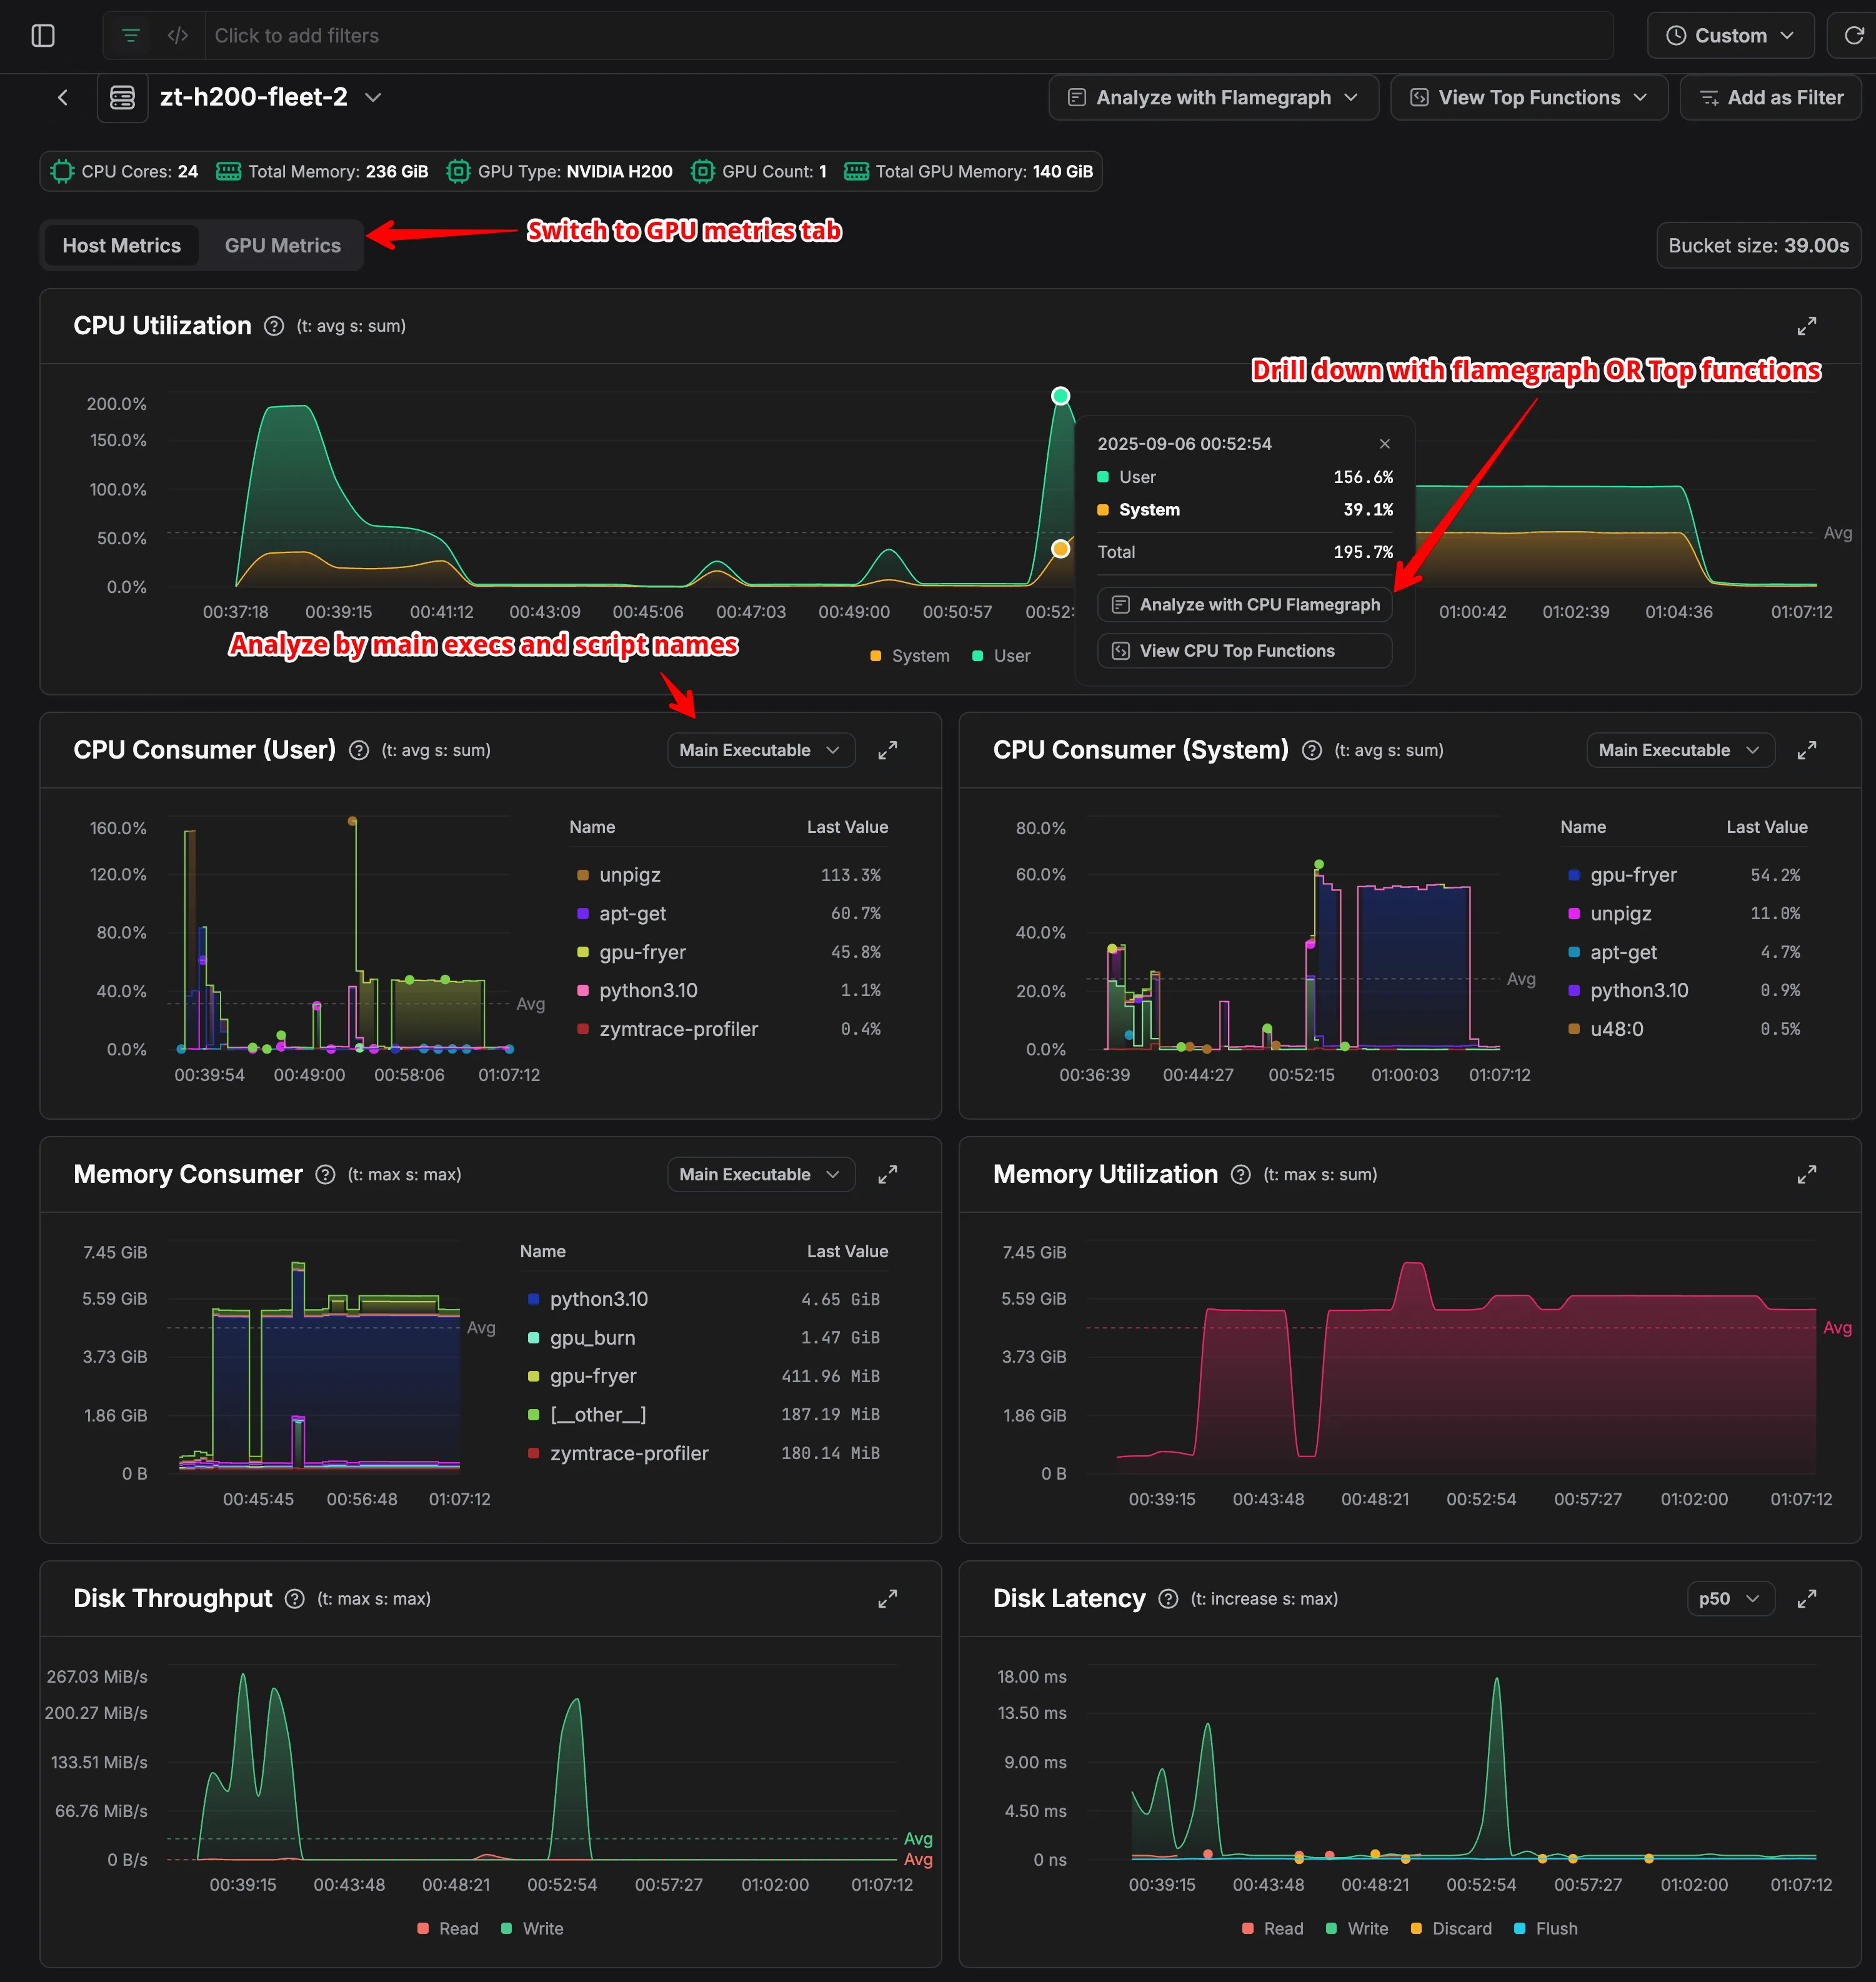
Host-level CPU and memory monitoring metrics
GPU utilization and memory monitoring metrics
Kubernetes Entities
zymtrace collects metrics and profiles for the following Kubernetes entities. Each entity type provides a consistent performance view with the same metrics, profiles, and drill-down capabilities. Here's a container list view:
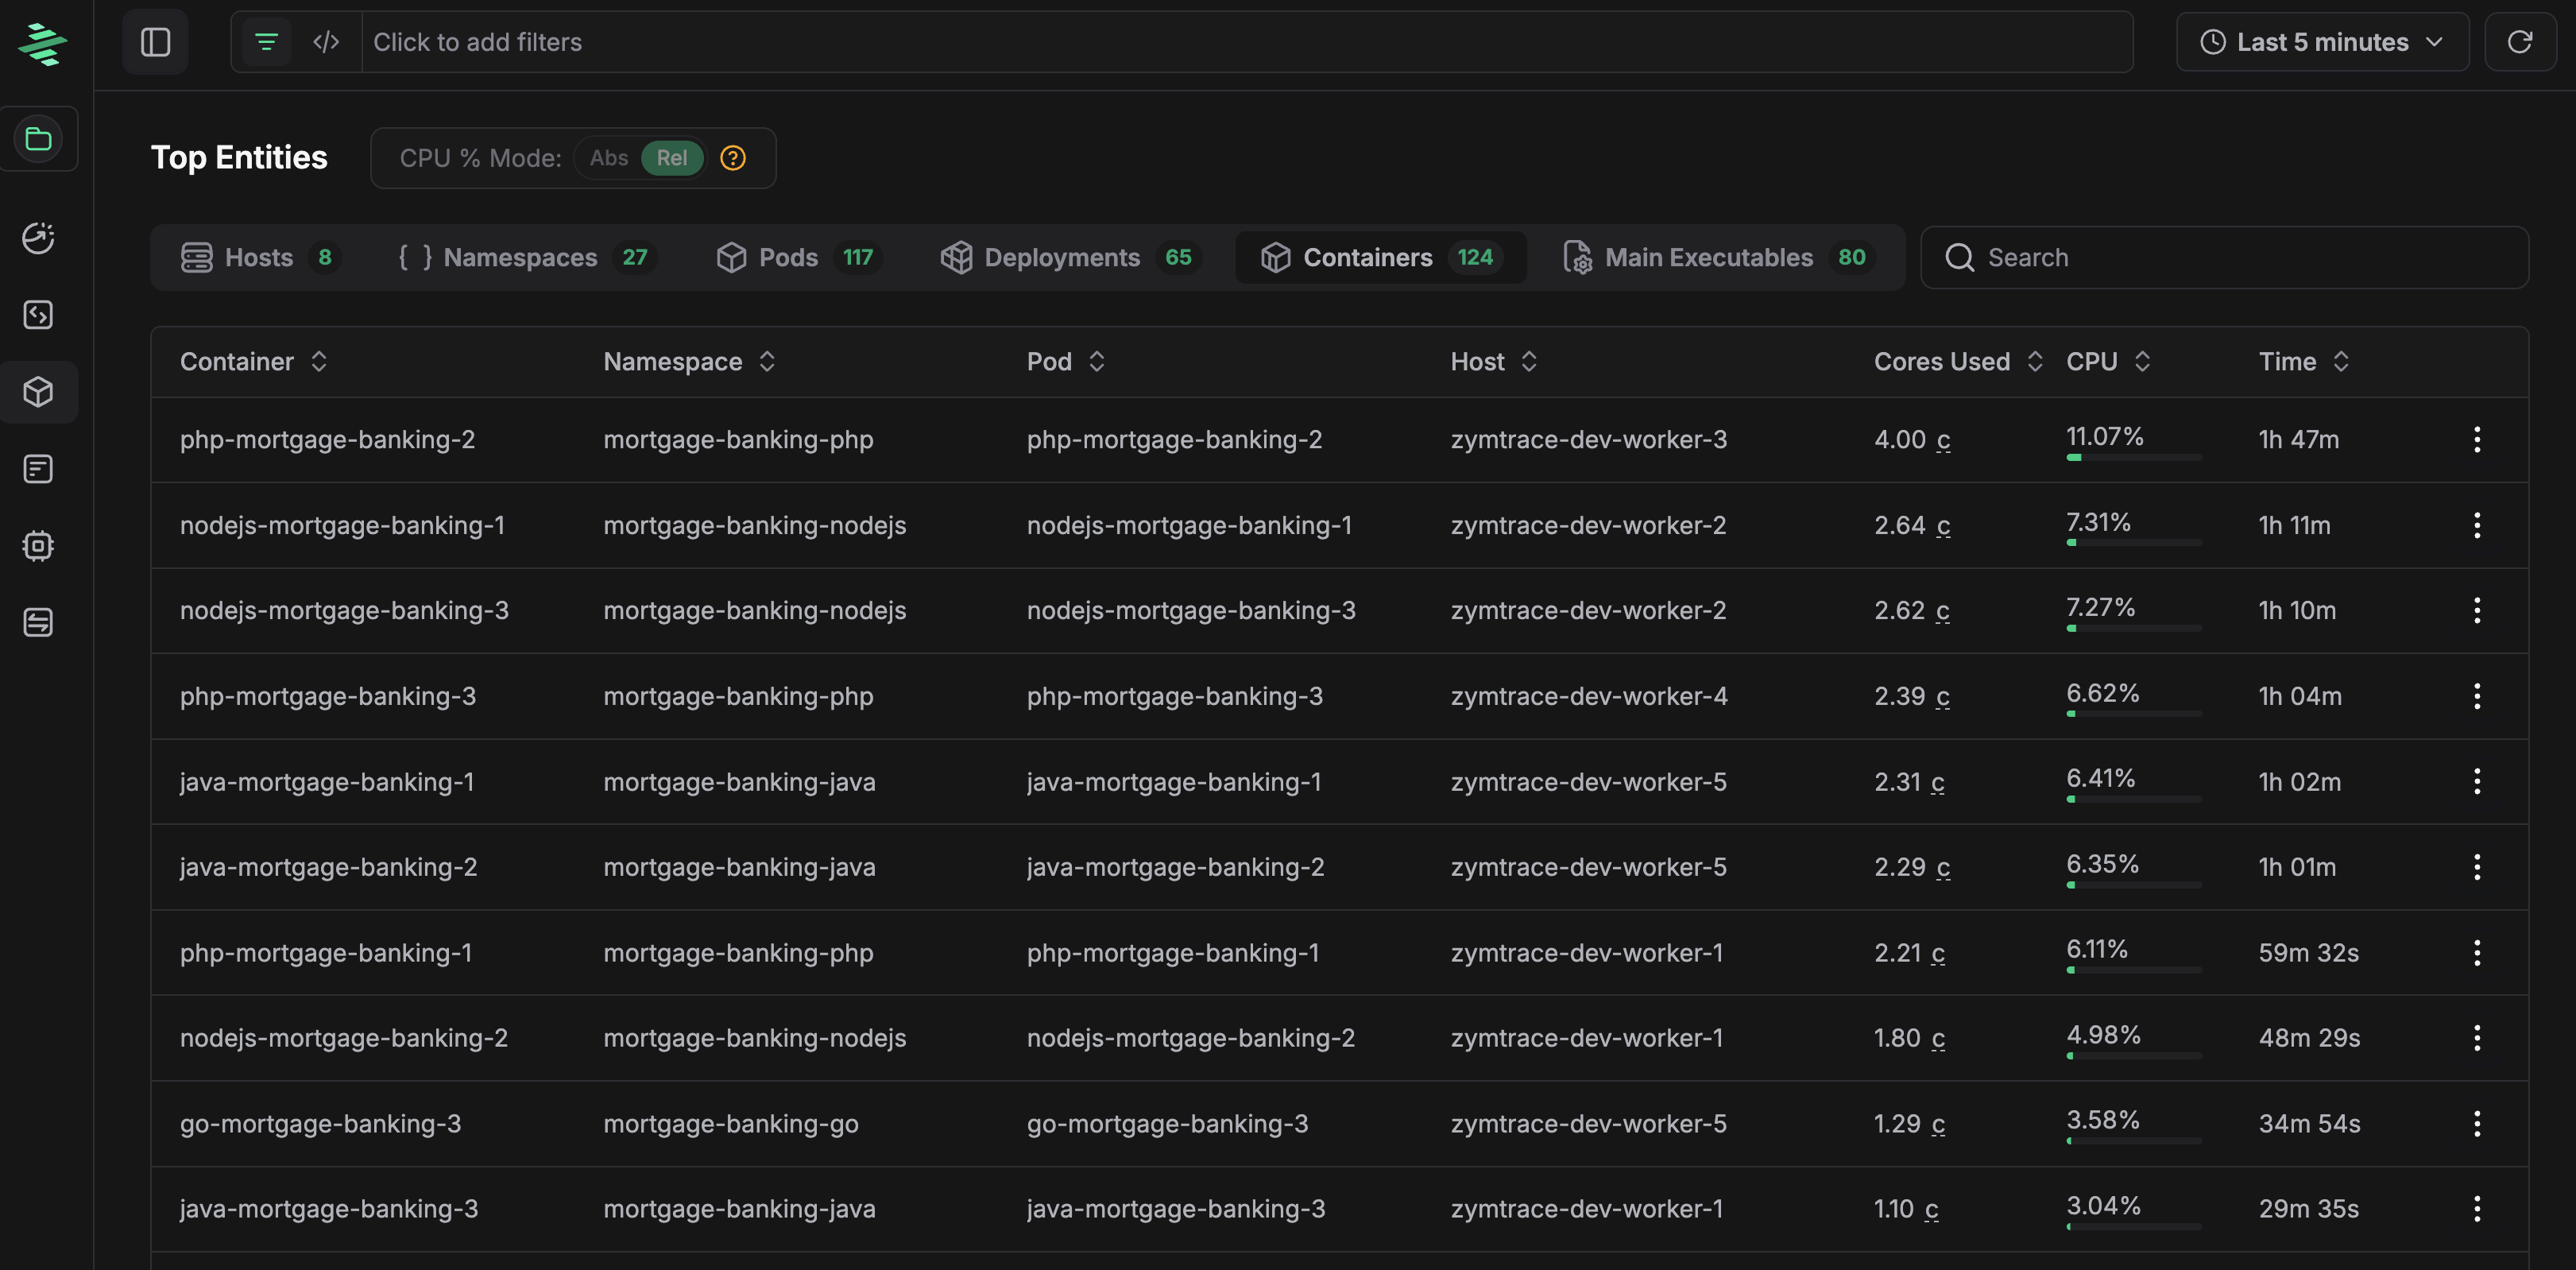
Containers entity list view
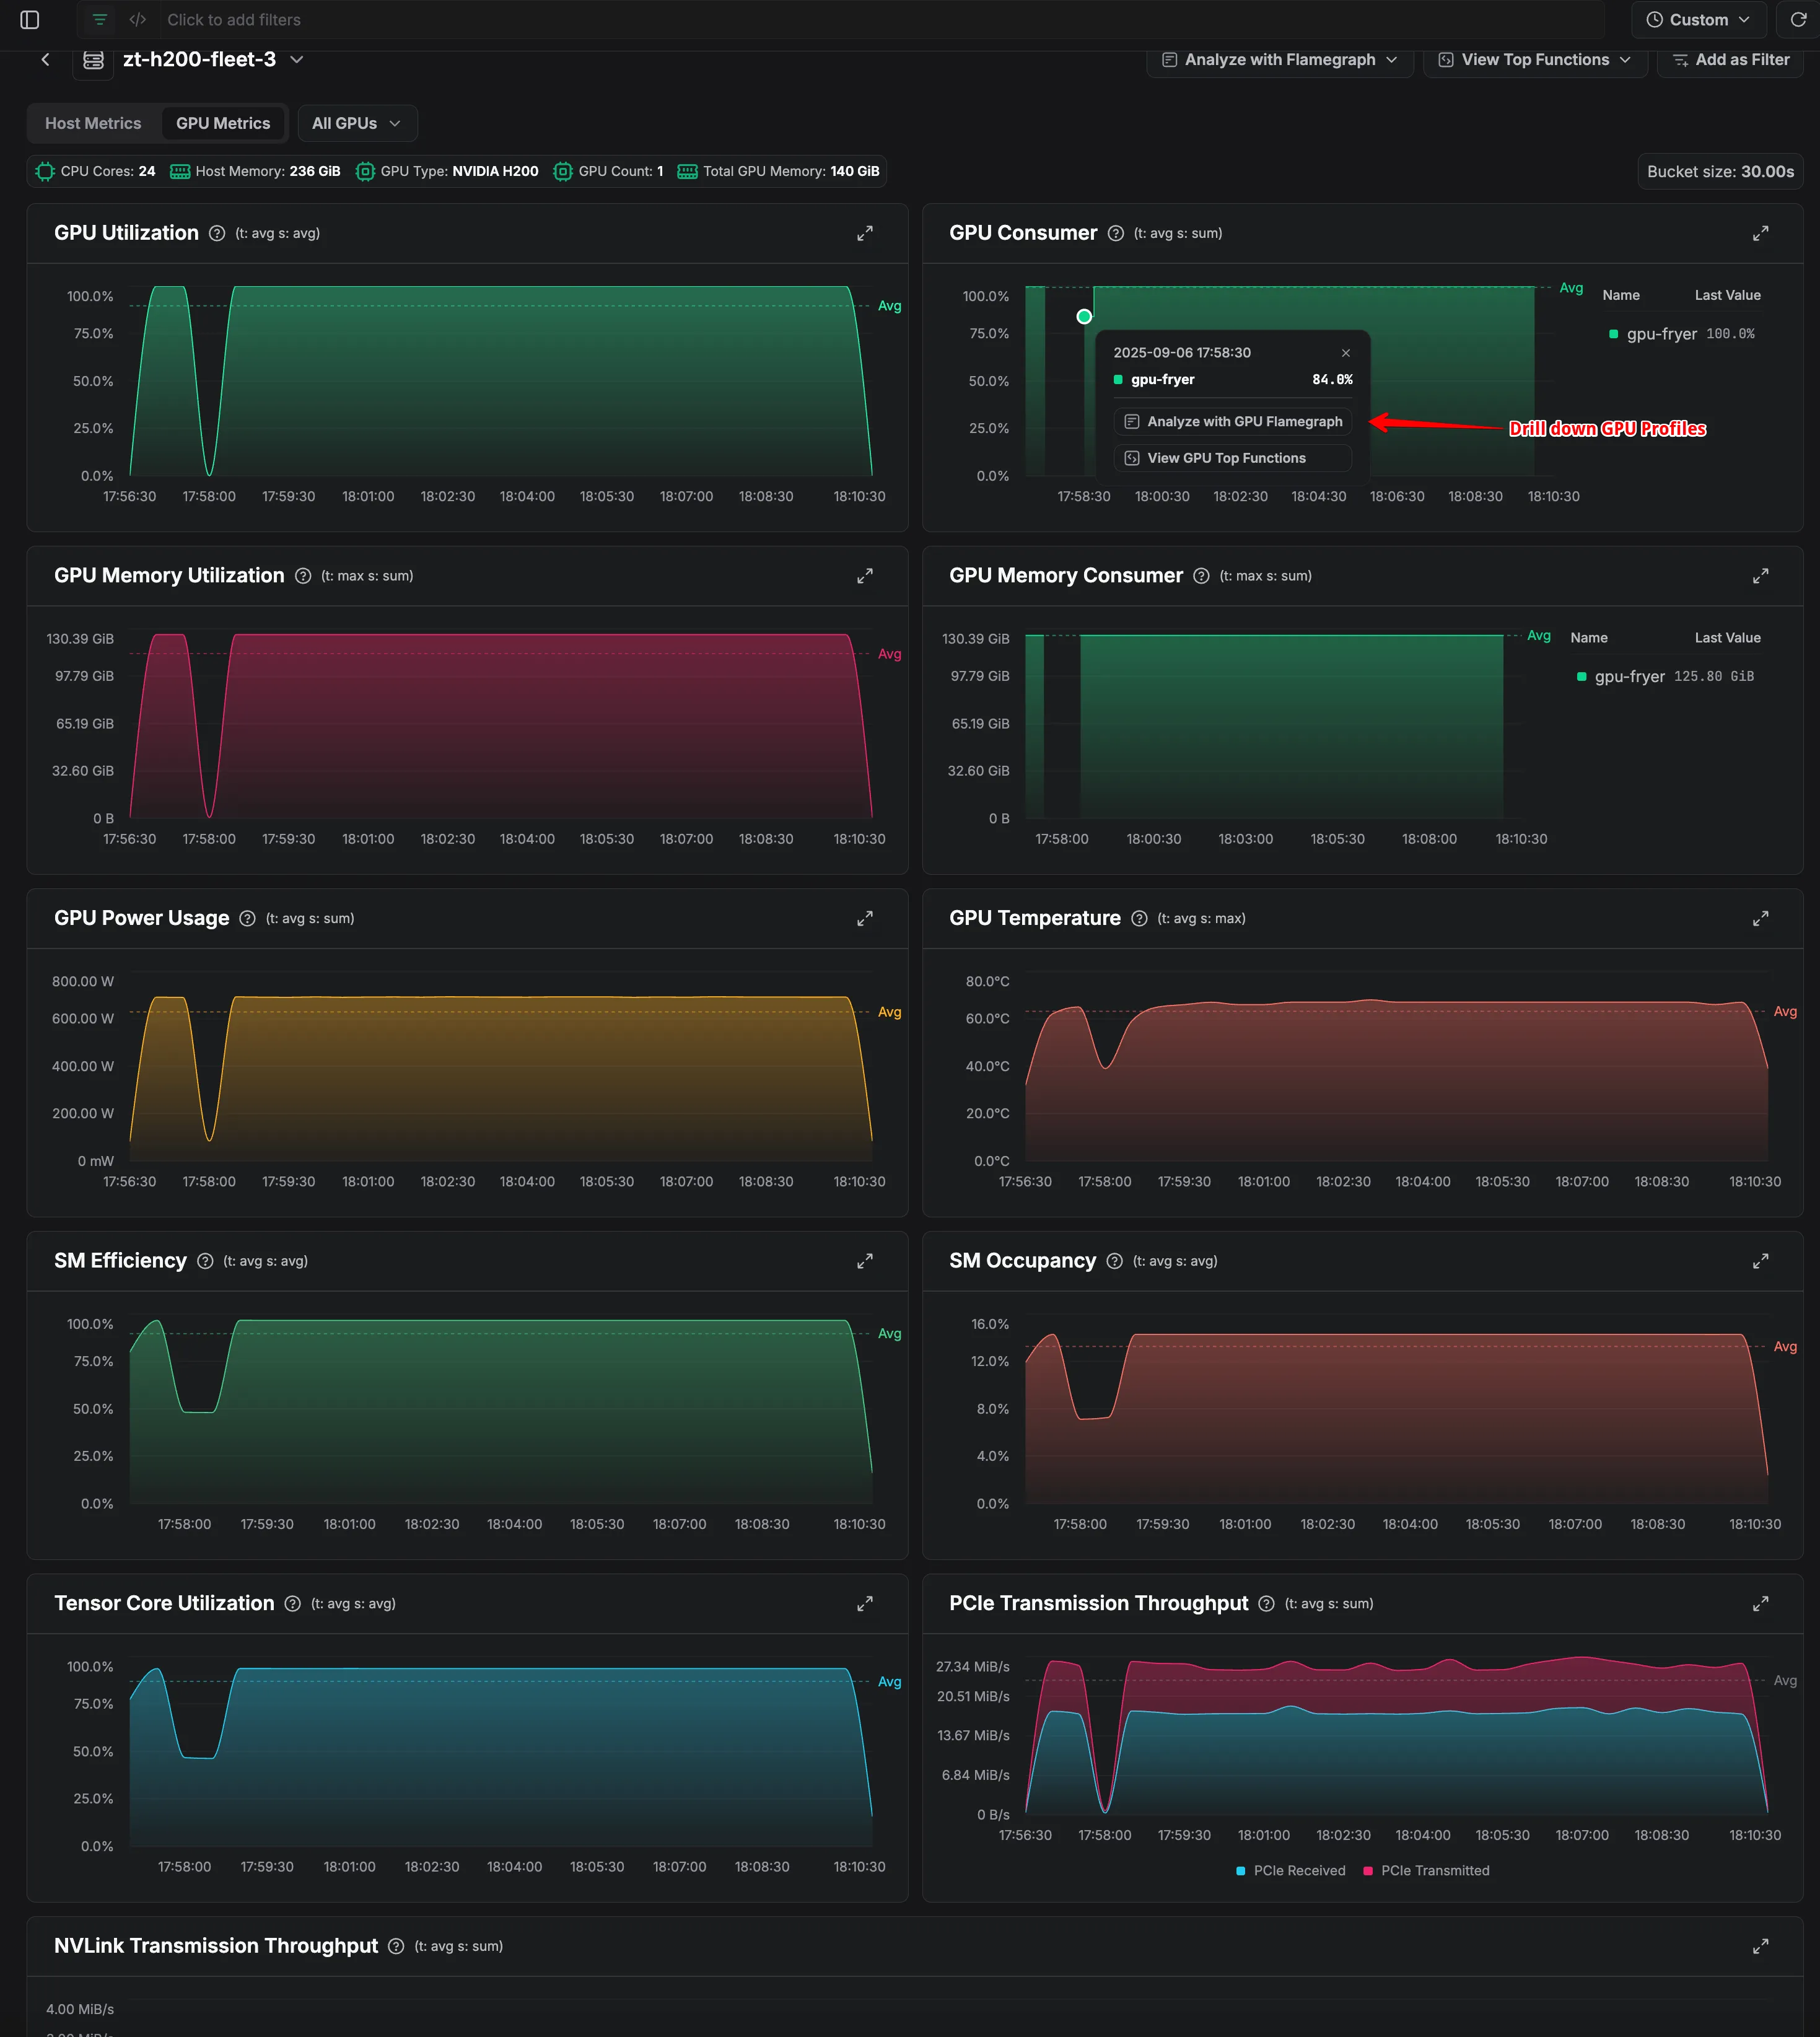
Container Detailed View
You can toggle between host and GPU metrics. Each metric data point is interactive. Click any point to drill down into the corresponding GPU or CPU profiles for that time range.
- Container Metrics
- GPU Container Metrics
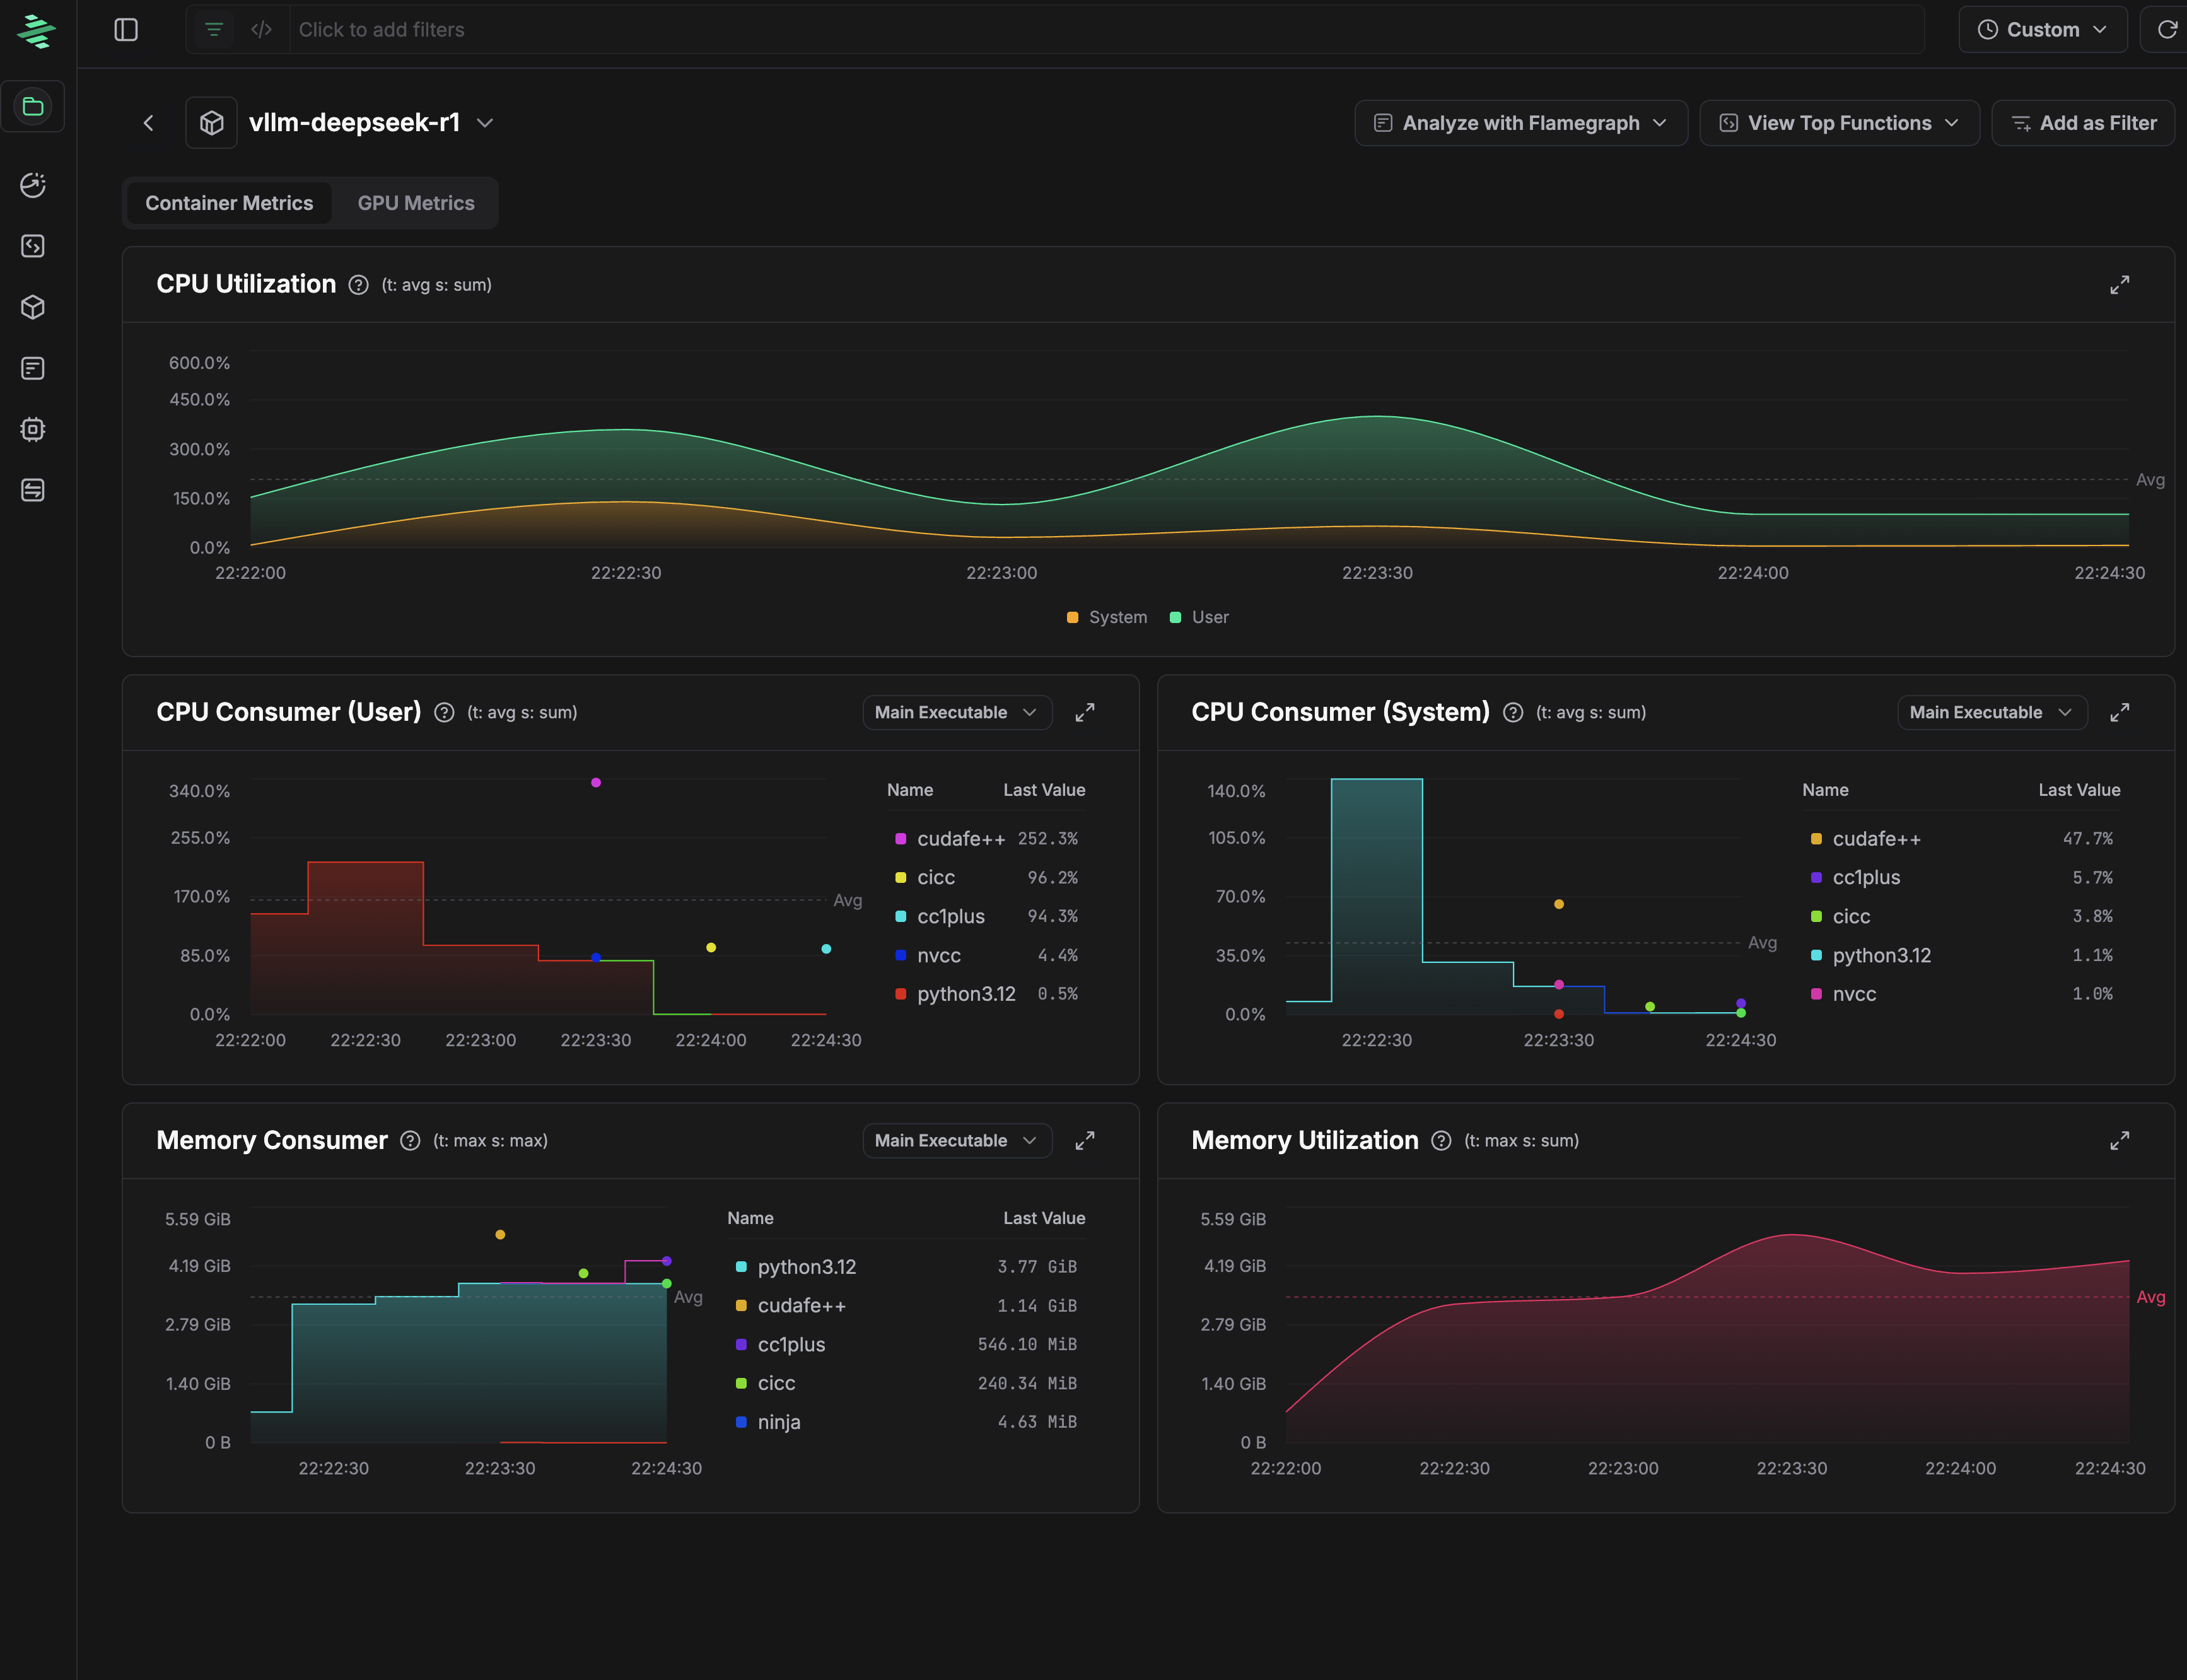
Container metrics
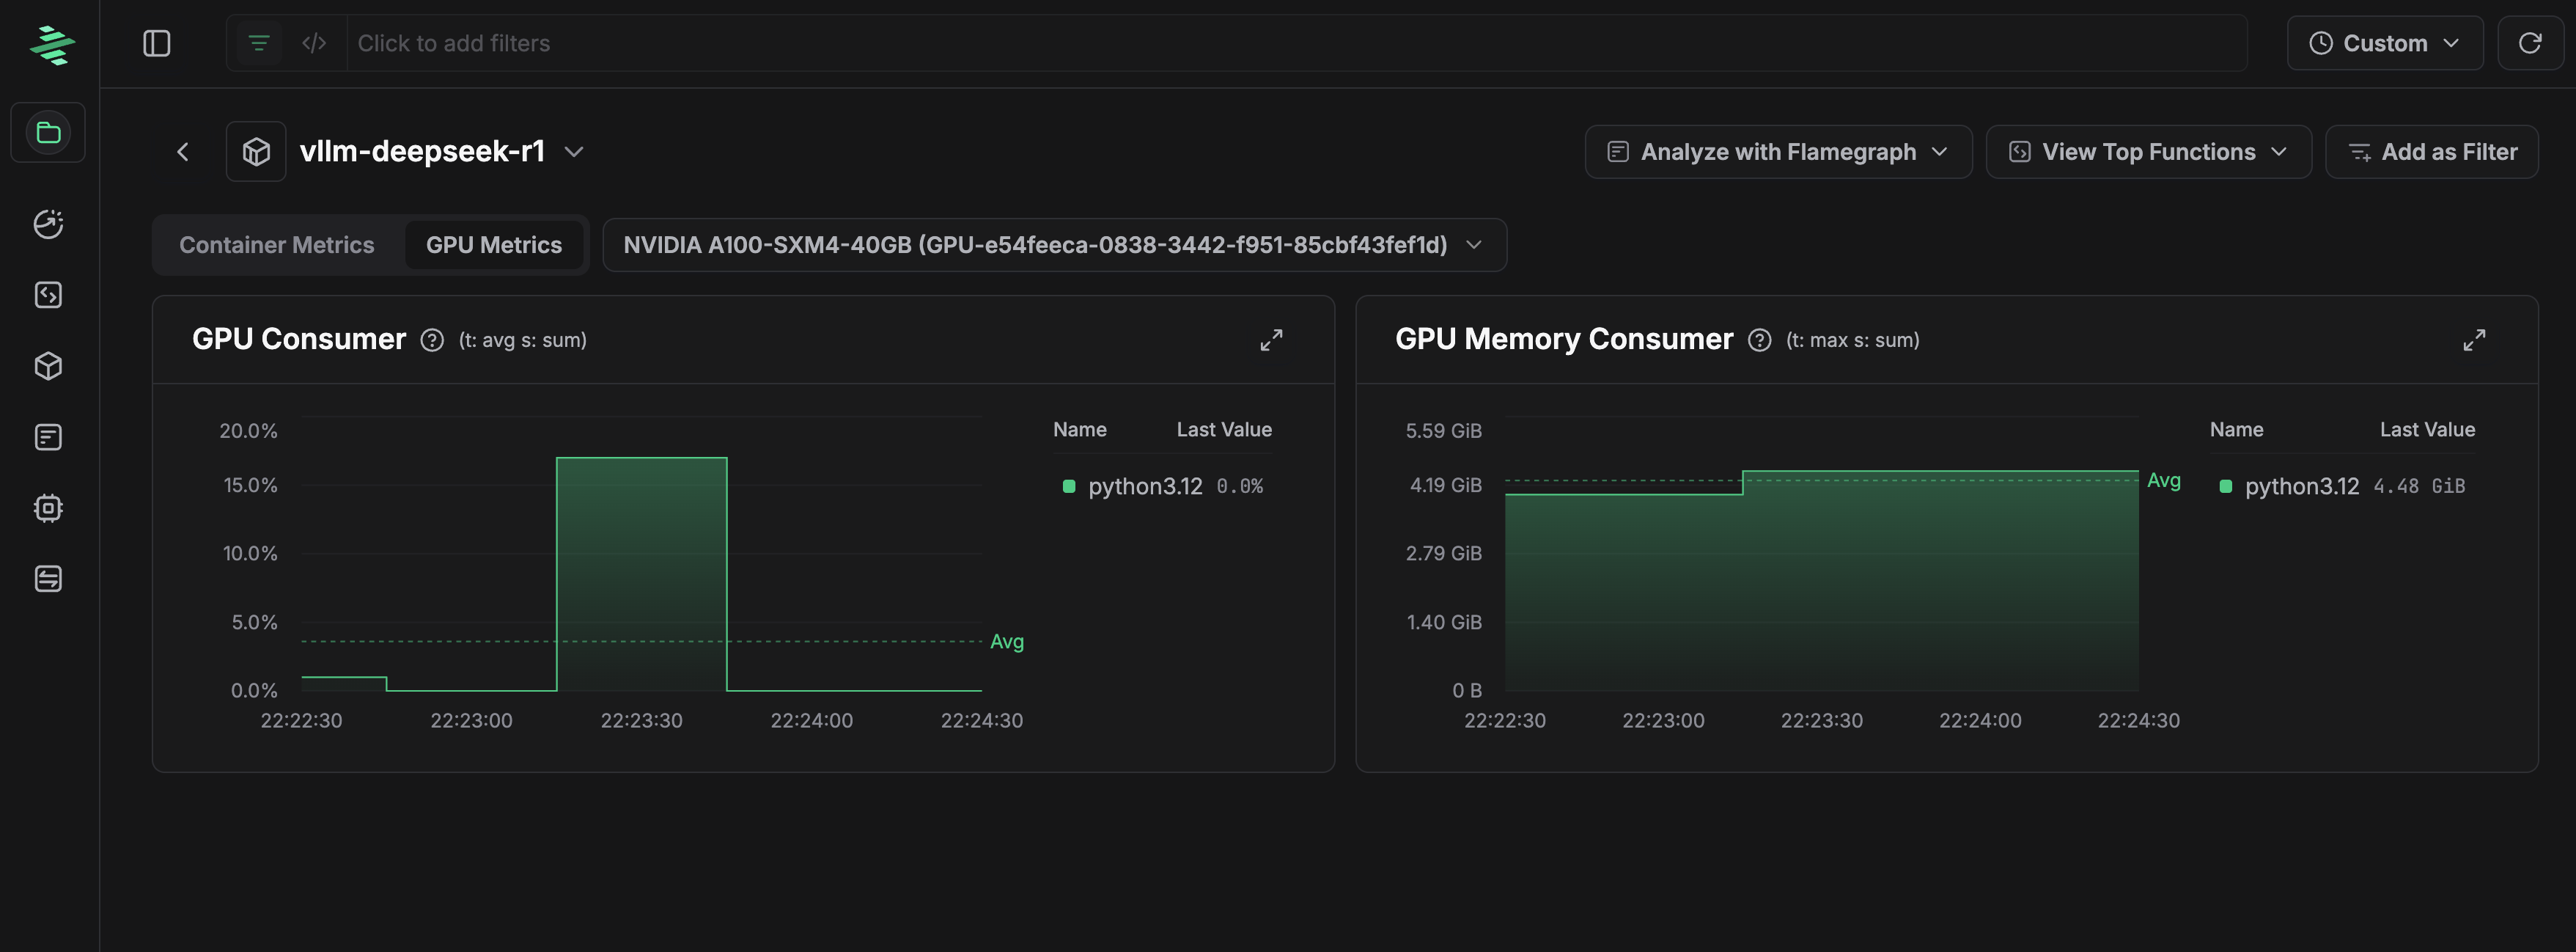
GPU Container Metrics
Main Executables
Main Executables differ from other entity types by grouping data by the primary process executable rather than infrastructure components. This view is particularly useful for:
- Process-level analysis – Understand which executables consume the most resources across your entire infrastructure
- Language runtime comparison – Compare resource usage across different runtimes (Python, Java, Node.js, etc.)
- Cross-service patterns – Identify if certain executables or runtimes consistently consume more resources regardless of where they run
- Optimize critical processes – Target the most resource-intensive executables for optimization
This view helps you answer questions like "How much CPU do all my Python processes consume?" or "Are our Java services more resource-intensive than our Go services?"
GPU utilization and memory monitoring metrics
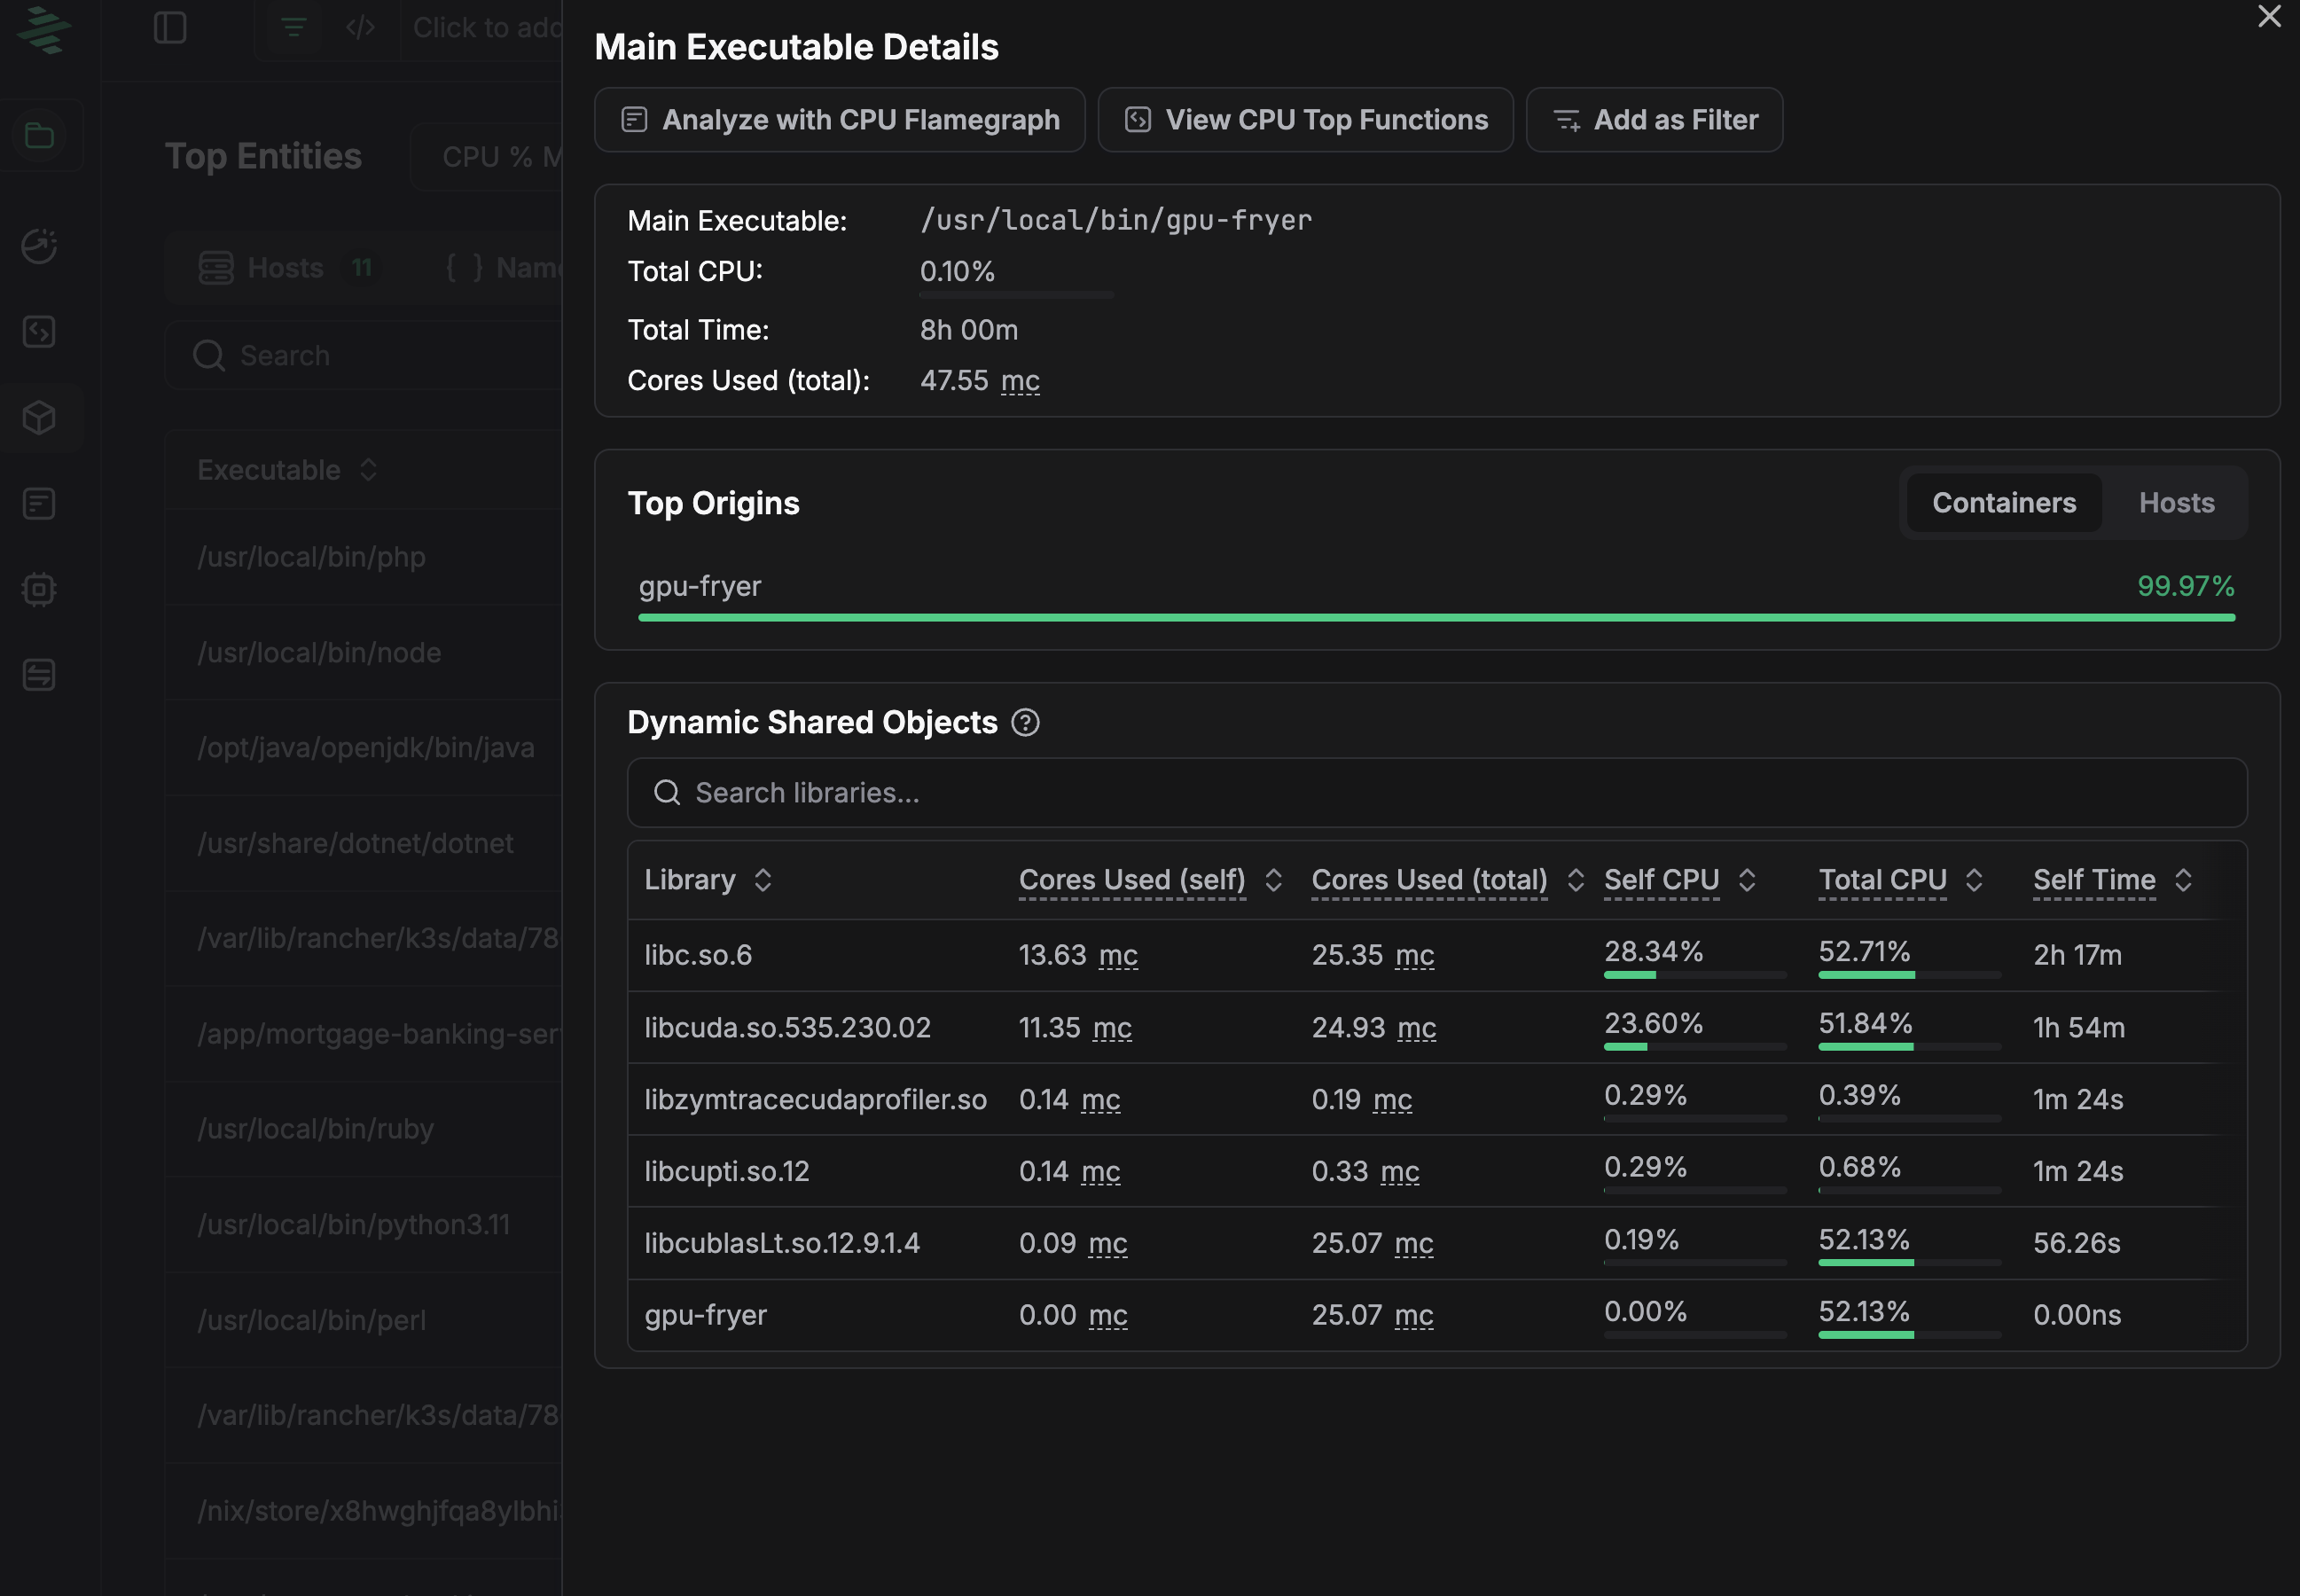
Top Origins
When viewing a main executable's details, you'll see Top Origins showing where this executable is running:
- Containers – Which containers are running this executable and their resource consumption
- Hosts – Which hosts are running this executable and their resource consumption
This breakdown helps you identify if resource consumption patterns vary by deployment location or if specific instances need attention.
Dynamic Shared Objects
The Dynamic Shared Objects section lists all libraries (shared objects/DLLs) that were loaded by the main executable. For each library, you can see:
- Cores Used (self) – CPU cores consumed by code executing directly in this library
- Cores Used (total) – Total CPU cores including functions this library calls
- Self CPU % – Percentage of CPU time spent executing code in this library
- Total CPU % – Percentage of CPU time including all functions called by this library
- Self Time – Time spent in the library's own code
- Total Time – Total time including all called functions
This view is essential for identifying which libraries contribute most to your executable's resource consumption, helping you target optimization efforts at the library level.
Actions
From any entity, you can:
- View Entity Details – See detailed information about the entity
- Analyze with Flamegraph – View a flamegraph for all functions in this entity
- View CPU Top Functions – See the top CPU-consuming functions in this entity
- View GPU Top Functions – See the top GPU-consuming functions in this entity
- Add as Filter – Filter the entire view to show only data from this entity