Efficiency IQ
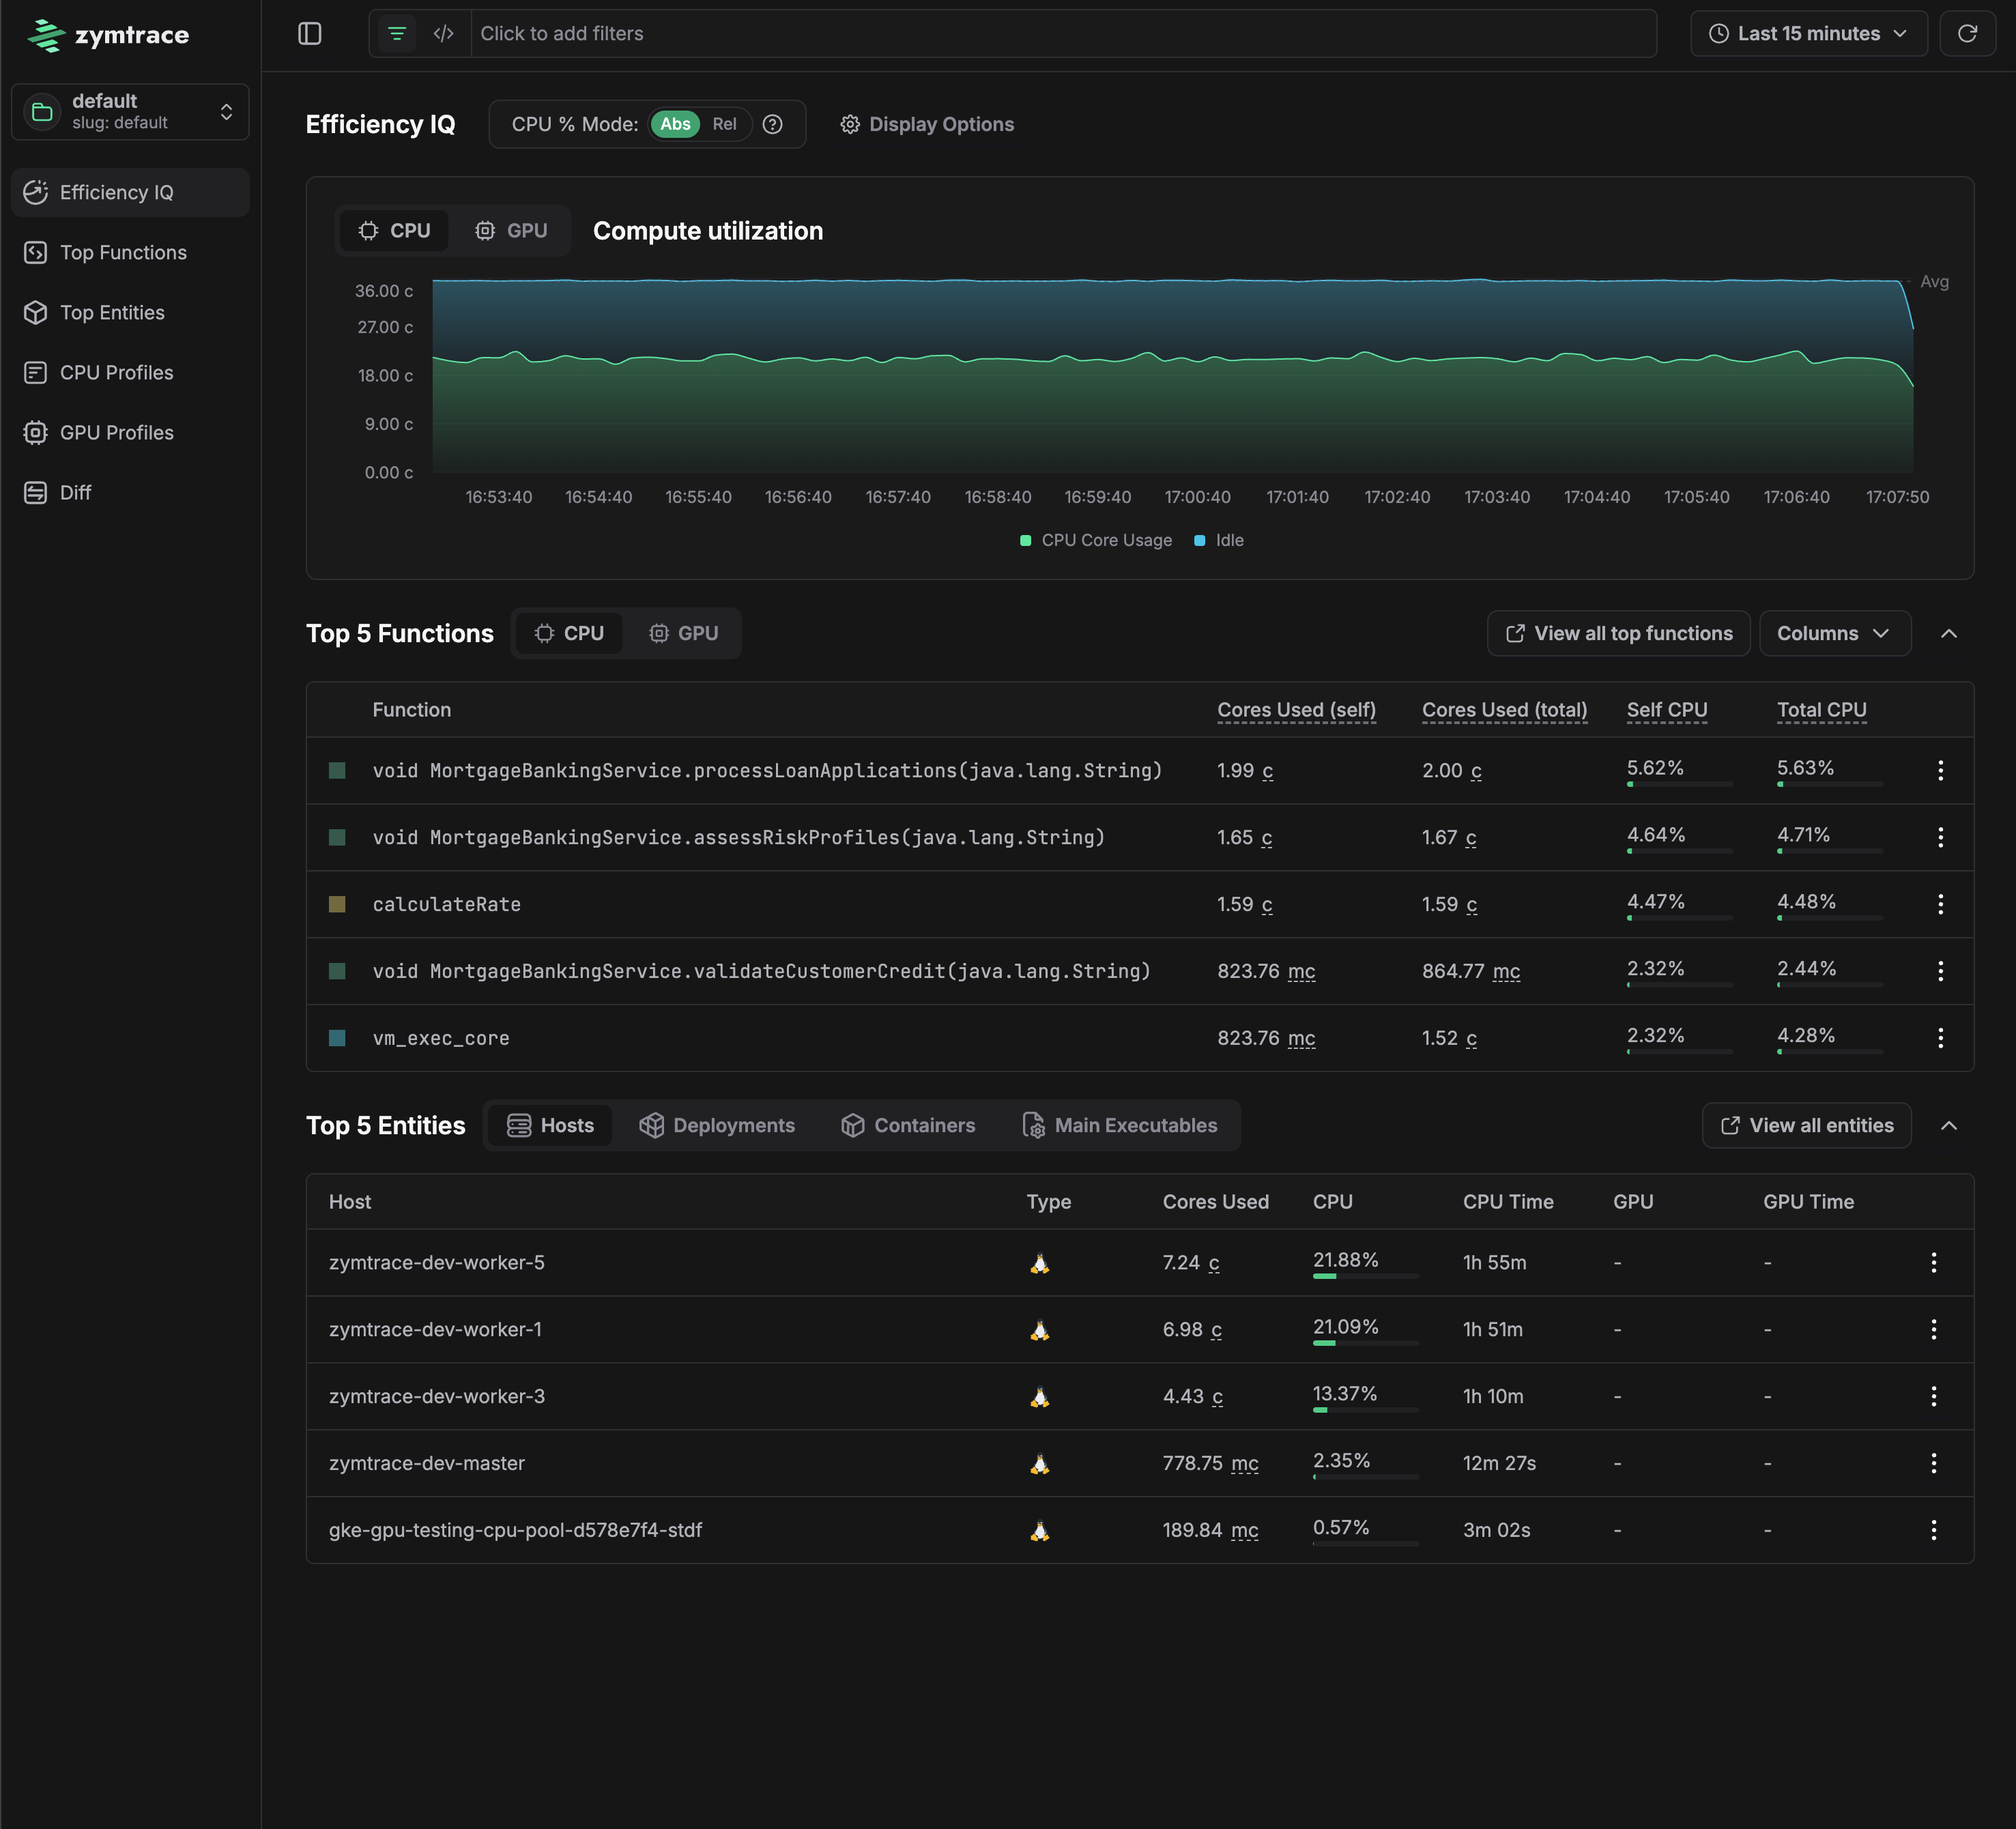
The Efficiency IQ dashboard is your main entry point into zymtrace. It provides a high-level overview of your system's performance, combining compute utilization, top functions, and top entities in a single view.
Efficiency IQ helps you quickly understand:
- Overall compute utilization across your entire fleet
- How much compute is actively used versus sitting idle
- Top 5 most expensive functions
- Top 5 entities - broken down by Hosts, Deployments, Containers, and Main Executables
Absolute vs Relative CPU Mode
You can view CPU utilization in absolute or relative mode:
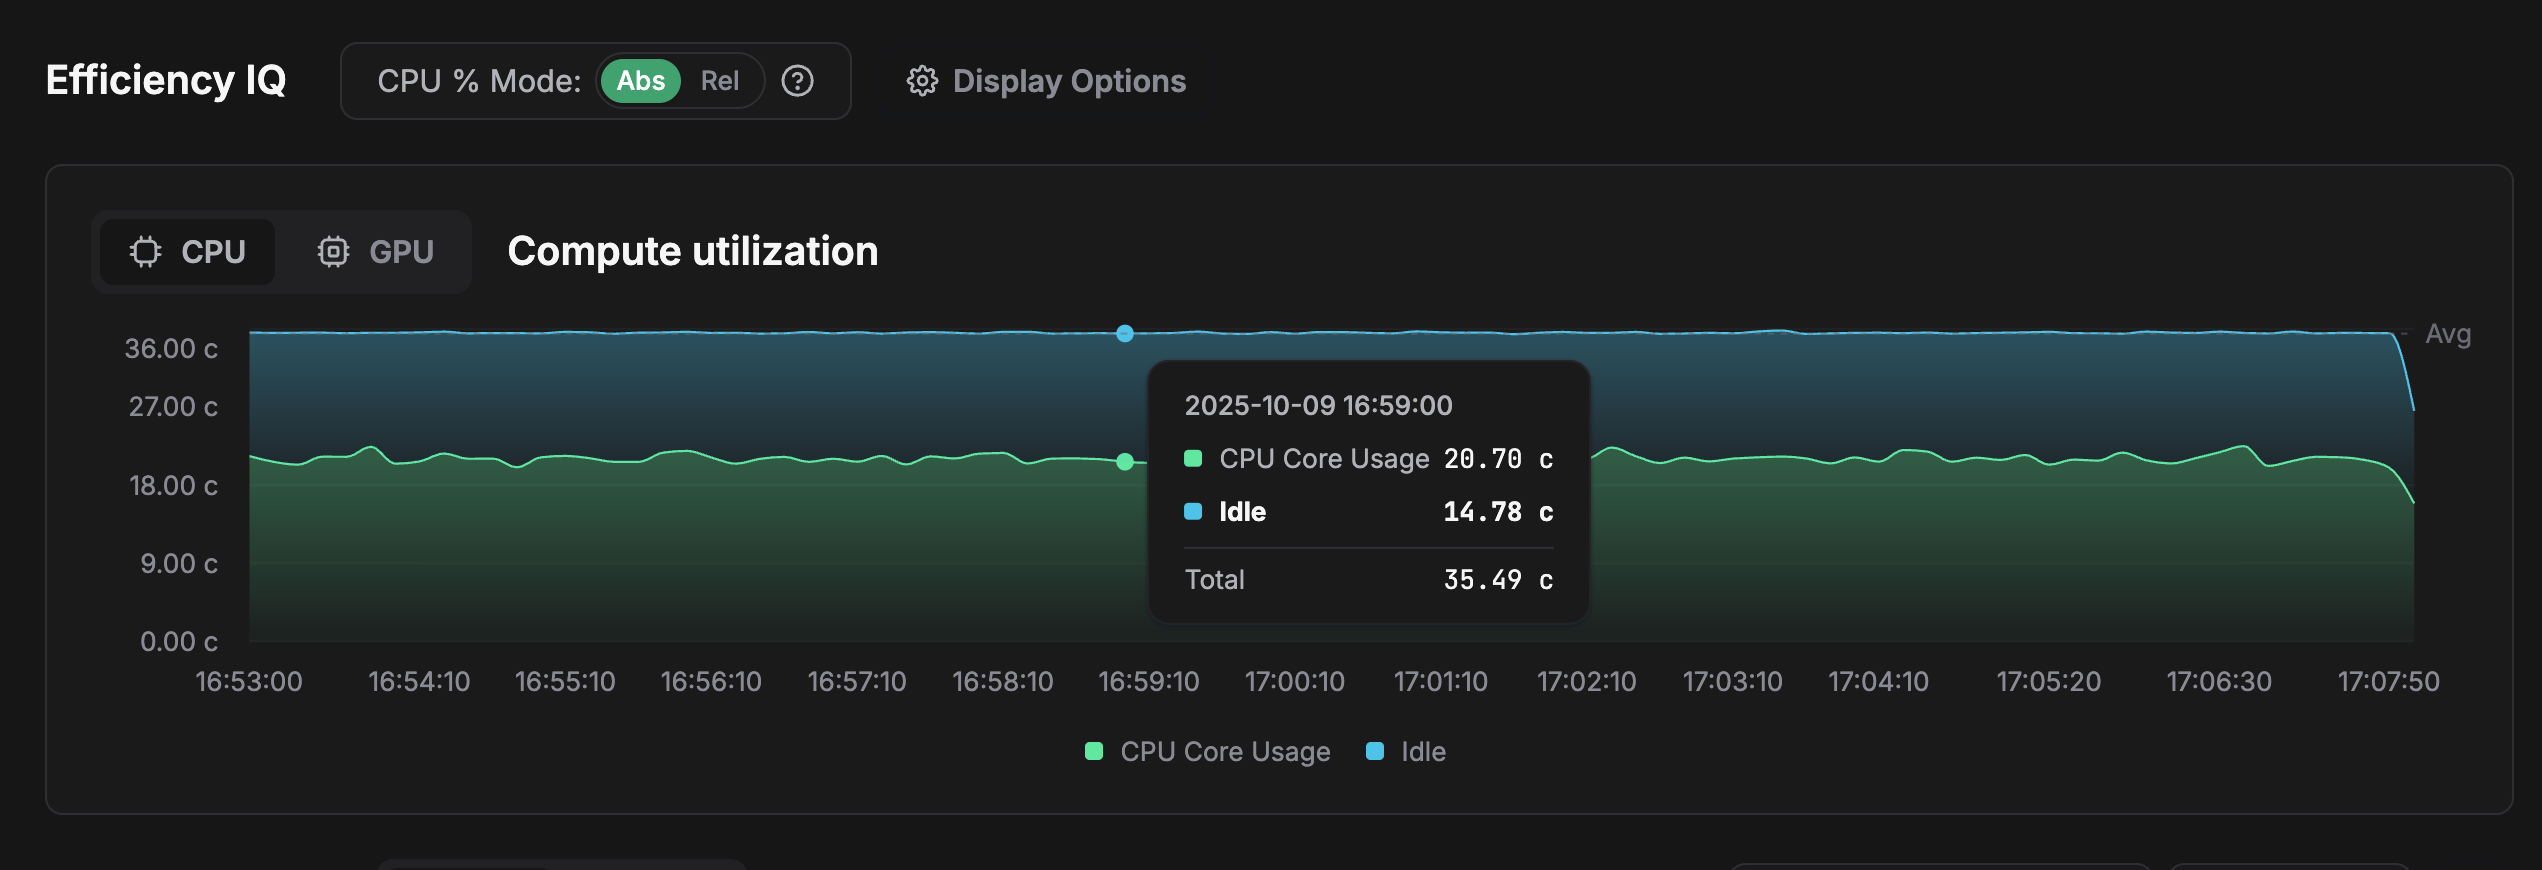
Absolute mode shows real CPU usage percentages — just like what you'd see in tools such as htop or btop.
For example, if your cluster has 2 machines with 8 cores each, and your profiled service uses 4 cores on each machine, Efficiency IQ will display 50% CPU usage for that service.
Relative mode presents CPU utilization in relation to other workloads you're profiling, helping you see which services dominate your compute resources.
GPU & CPU Toggles
zymtrace profiles both CPU and GPU. You may toggle between CPU and GPU tabs on the efficiency IQ page and on most pages.
All GPU profiling times are currently relative.
zymtrace efficiency IQ