Introduction to Flamegraphs
A flamegraph is one of the most effective ways to understand how your application uses compute resources across CPUs and GPUs. It shows where your code spends time, why CPUs are busy, and why GPUs might be underutilized. When we profile your application through sampling, we can generate thousands of lines of data that reveal which code paths are hot (i.e., busy on-CPU). Flamegraphs condense this data into a single, interactive visualization, making it easy to identify which parts of your application consume the most compute and how that usage flows through your call stack.
This visualization helps you quickly identify bottlenecks and inefficiencies across your entire system — turning what would be an overwhelming list of stack traces into an immediately comprehensible picture of your code's behavior.
In this tutorial, we'll focus on CPU flamegraphs, which show how your program uses the CPU over time. While zymtrace also supports GPU profiling, we covered the differences between CPU and GPU flamegraphs here. For now, let's learn how to spot performance bottlenecks using flamegraphs.
Before diving into how to read a flamegraph, let's review how zymtrace collects and organizes profiling data.
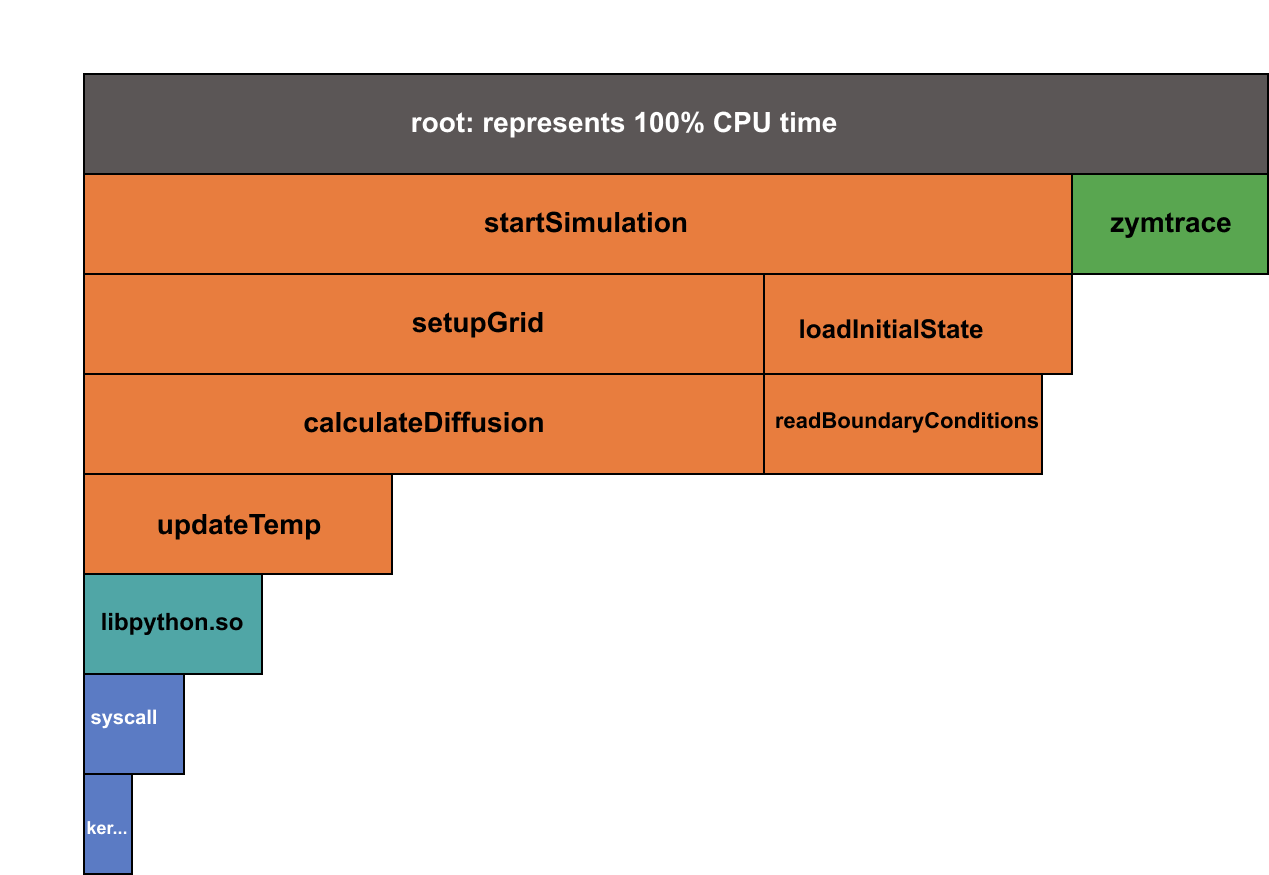 An illustration of a flamegraph
From Stack Traces to Flamegraph
A stack trace is a snapshot of the call stack at a specific moment, capturing the chain of function calls from your application's entry point down to the currently executing code. Think of it as a breadcrumb trail showing exactly how your program arrived at a particular line.
Stack traces are the foundation of profiling; they reveal what your application is executing and, crucially, help you trace back the steps that led to high resource usage.
Profiling platforms rely on stack traces to pinpoint which code is running when your servers are consuming high CPU. Tools like top show which processes use the most CPU, but lack the detail to identify the exact lines of code responsible.
To provide code-level insight, zymtrace samples every busy process at 19Hz by default, using eBPF to profile not only your code but also third-party libraries and kernel execution. This whole-system approach means you see everything that contributes to resource usage.
However, interpreting millions of stack traces across your fleet is challenging. This is the problem flamegraphs were invented to solve.
Let's look at a simple example. Imagine an application modeling thermal diffusion. After profiling, zymtrace might collect results similar to the function call stacks shown below.
| Percentage | Function Calls |
|---|---|
| 57% | startSimulation → setupGrid → calculateDiffusion |
| 31% | startSimulation → loadInitialState → readBoundaryConditions |
| 26% | startSimulation → setupGrid → calculateDiffusion → updateTemp |
| 15% | startSimulation → setupGrid → calculateDiffusion → updateTemp → libpython.so |
| 9% | startSimulation → setupGrid → calculateDiffusion → updateTemp → libpython.so → syscall |
From this table, you can see that the deep call sequence through calculateDiffusion → updateTemp → libpython.so is predominant, indicating that the main performance bottleneck lies in the calculateDiffusion function.
While this breakdown works for small examples, production systems generate millions of unique stack traces across many processes, libraries, and kernel calls. A flamegraph condenses all that data into a single, readable view, making it possible to find bottlenecks at a glance.
Following the Shape of the Graph
zymtrace uses an Icicle Graph, an inverted version of the classic flamegraph. The principles are the same — only the orientation changes. The key elements to look out for are:
- Rectangles — Each rectangle (or "frame") represents a single function call.
- Hierarchy (Y-axis) — The vertical position shows the call stack depth. The root function appears at the top, and its children are drawn directly below.
- Width (X-axis) — The width of each rectangle represents how much total CPU time that function and its descendants consume. Wider means costlier.
Note that the x-axis does not represent time; zymtrace uses left-heavy sorting, where the most expensive child functions appear on the left side of their parent. This design makes hotspots immediately visible.
In more practical terms, use the following rules and actions:
Width: Finding the Hot Spots
Rule: The wider the rectangle, the more total CPU time that function (and its children) consumes.
Action: Scan the graph left to right. The widest blocks are your hotspots — functions or code paths that take up most of the CPU time. Start your investigation there.
Hierarchy: Tracing the Source
Rule: Functions below a parent consume part of the parent's time.
Action: When you see a wide parent function whose width is dominated by a single child, the child is the true source of cost.
For example, if calculateDiffusion is wide because of calls through updateTemp, that deeper call path is your real optimization target.
This vertical inspection helps you separate who calls what and where the time actually goes.
Height: Spotting Complexity
Rule: Tall stacks mean deep call hierarchies — often a sign of high abstraction or recursion.
Action: Deep stacks aren't always bad, but they can signal unnecessary complexity. Consider simplifying overly nested code paths or flattening heavy recursive calls.
Searching and Navigating in zymtrace
Large flamegraphs can be overwhelming, so zymtrace includes search and navigation features:
- Use the Search bar
- Enter a function name or regex pattern.
- The graph will be filtered to remove any stack traces that don't match the search value and the functions are highlighted.
Refer to the next section for details.
A Simple Optimization Workflow
In summary, here's a repeatable process for using zymtrace flamegraphs effectively:
- Profile continuously — zymtrace automatically captures stack data across your system.
- Scan horizontally — look for wide functions; these are your CPU hotspots.
- Drill down vertically — trace the cost to the child functions causing it.
- Check depth — note deep or complex stacks that may benefit from simplification.
- Optimize and measure — refactor, then use zymtrace again to confirm improvements.