Using the Flamegraph
The zymtrace flamegraph is a mixed-stack flamegraph, meaning it visualizes call stacks across multiple runtimes. This power comes with complexity — the volume of data can be overwhelming — so we've designed controls to help reduce noise and clutter.
To analyze performance more effectively, use the filters to narrow your view to specific workloads or areas of interest.
Difference between GPU and CPU Flamegraphs
The main difference between CPU and GPU flamegraphs is the introduction of CUDA-specific frames: CUDA Instruction Offset, CUDA Kernel, CUDA Kernel Launch, CUDA SASS Mnemonic, and CUDA Stall Reason. Additionally, the measurement units differ—GPU flamegraphs use GPU time, while CPU flamegraphs use CPU time (both relative time and absolute CPU core usage). Refer to the Unit Reference for detailed explanations. All other controls and features remain the same across both flamegraph types.
- CPU Flamegraph
- GPU Flamegraph
The zymtrace CPU profiler unwinds stacks across the full execution path, from high-level languages through user space to the kernel.
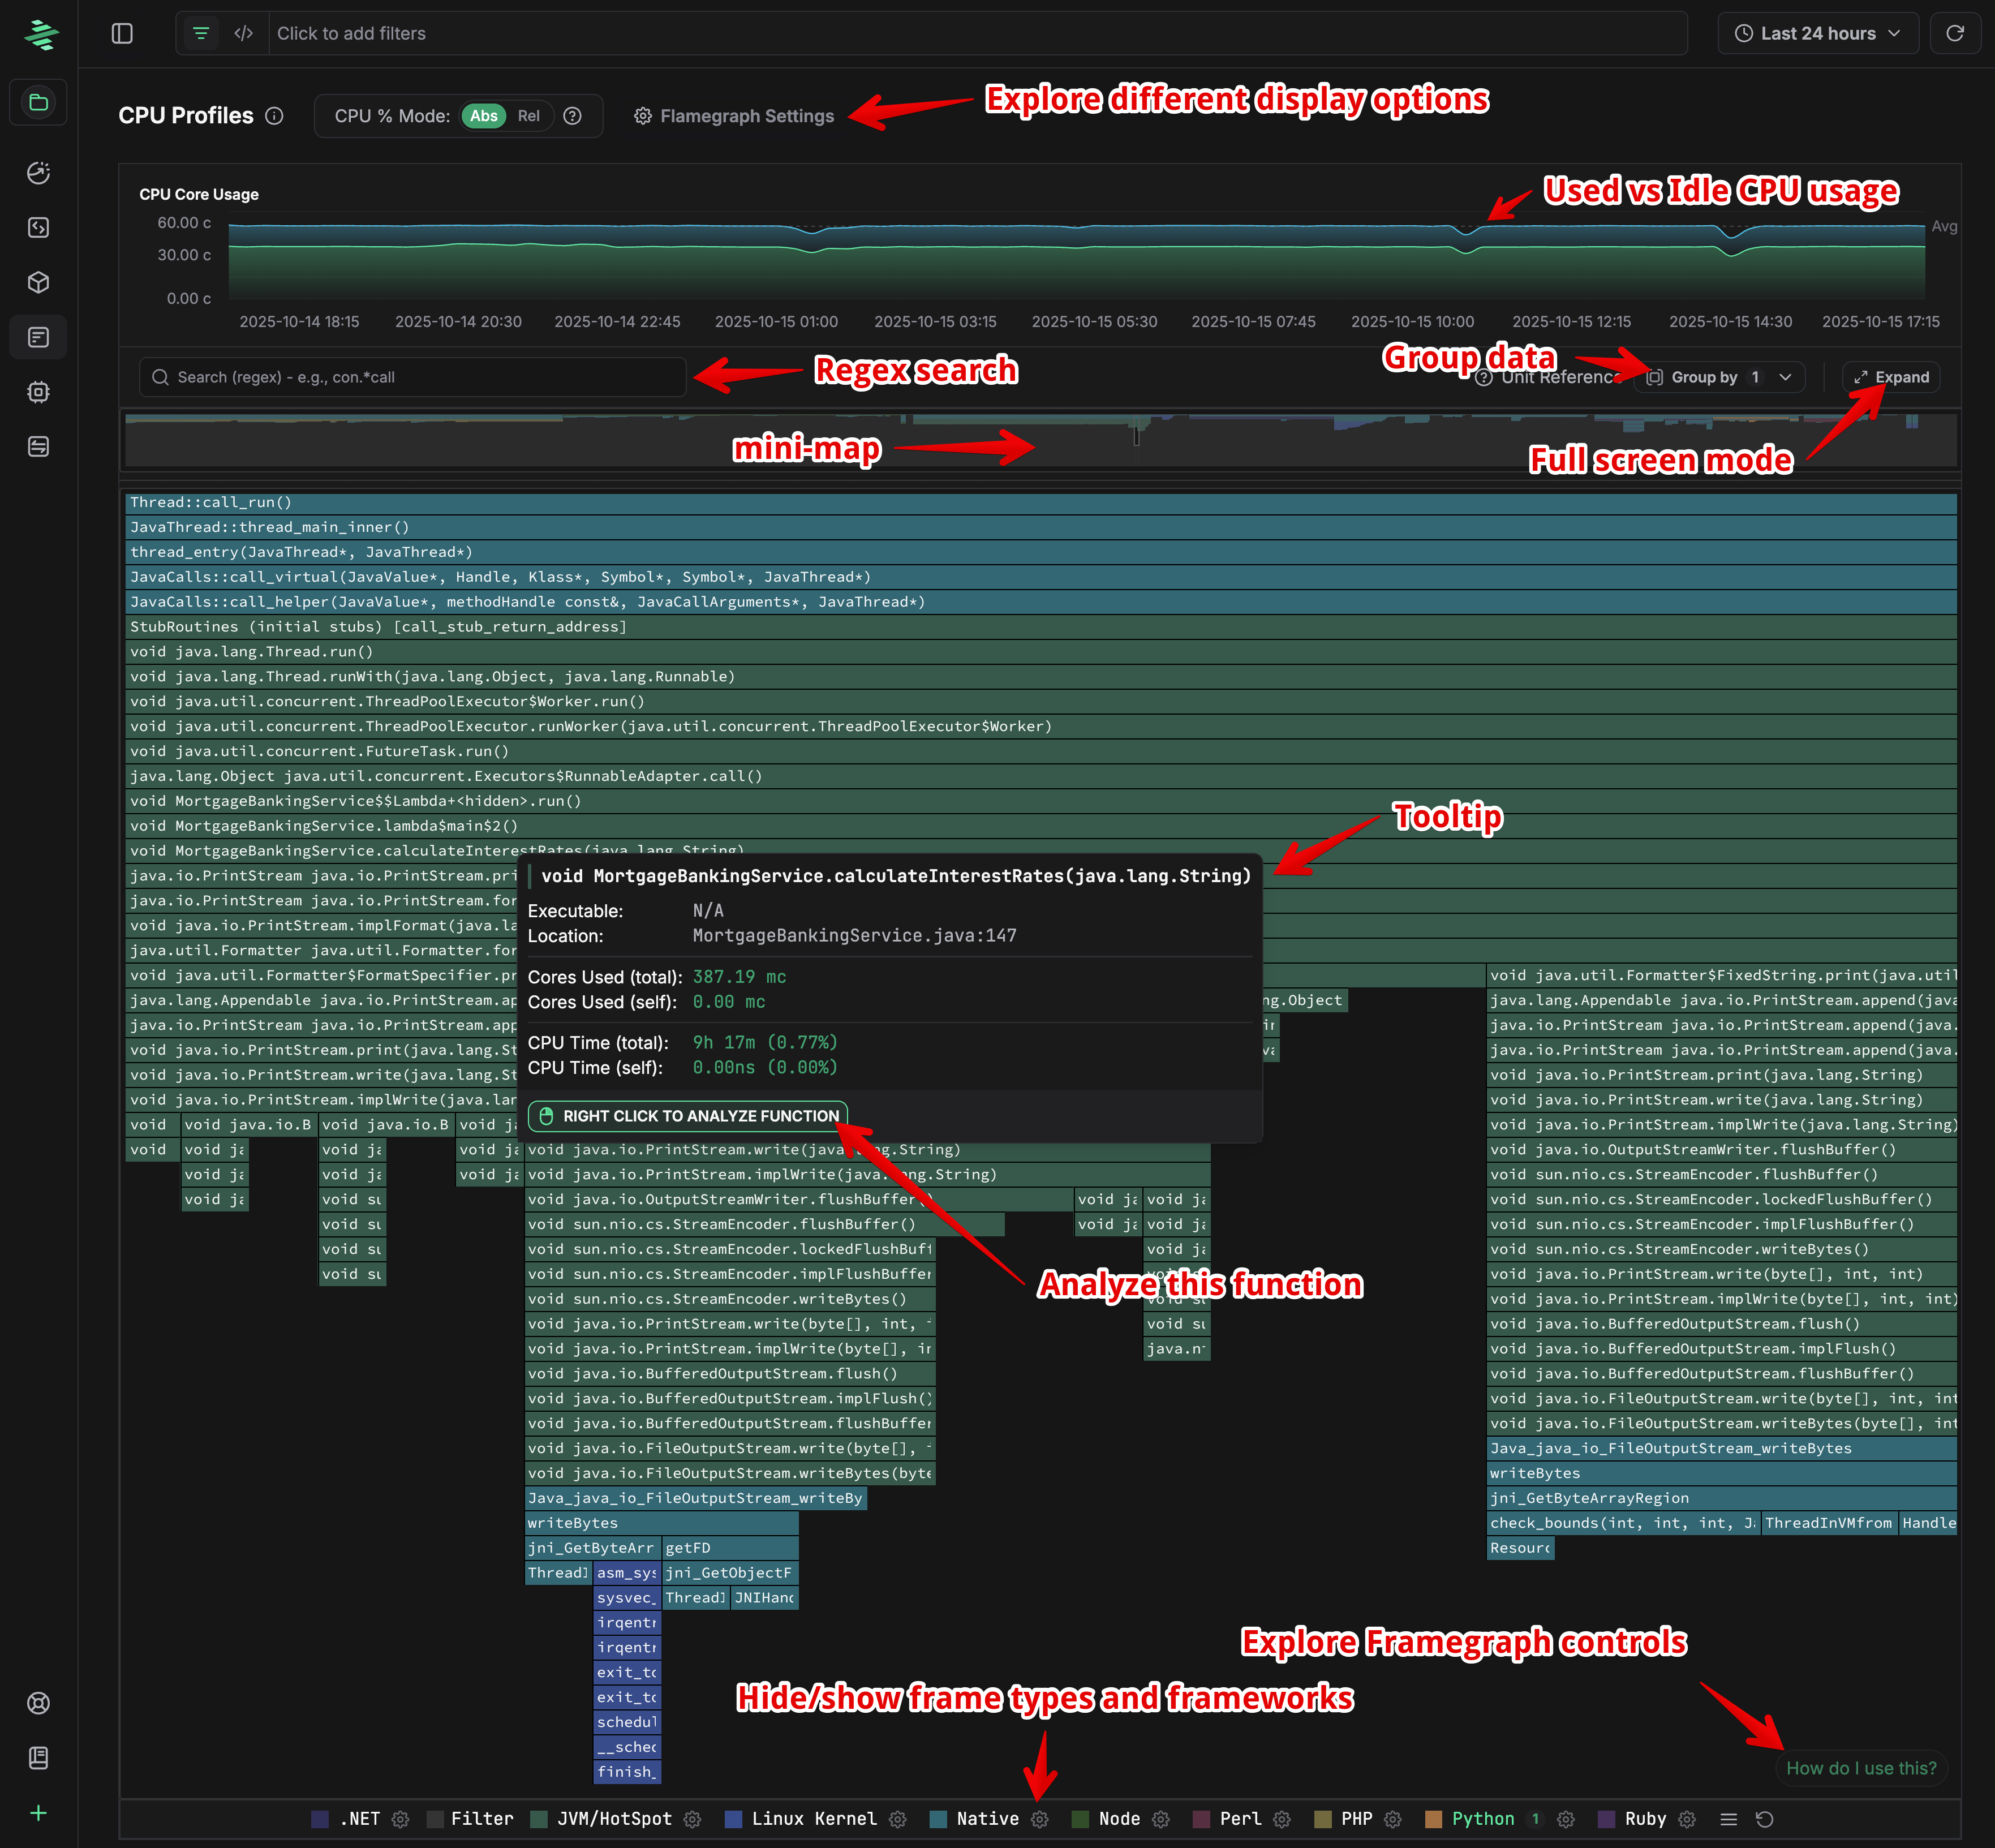 CPU flamegraph showing function call stacks and CPU time consumption
Refer to GPU Profiler architecture to learn how it works.
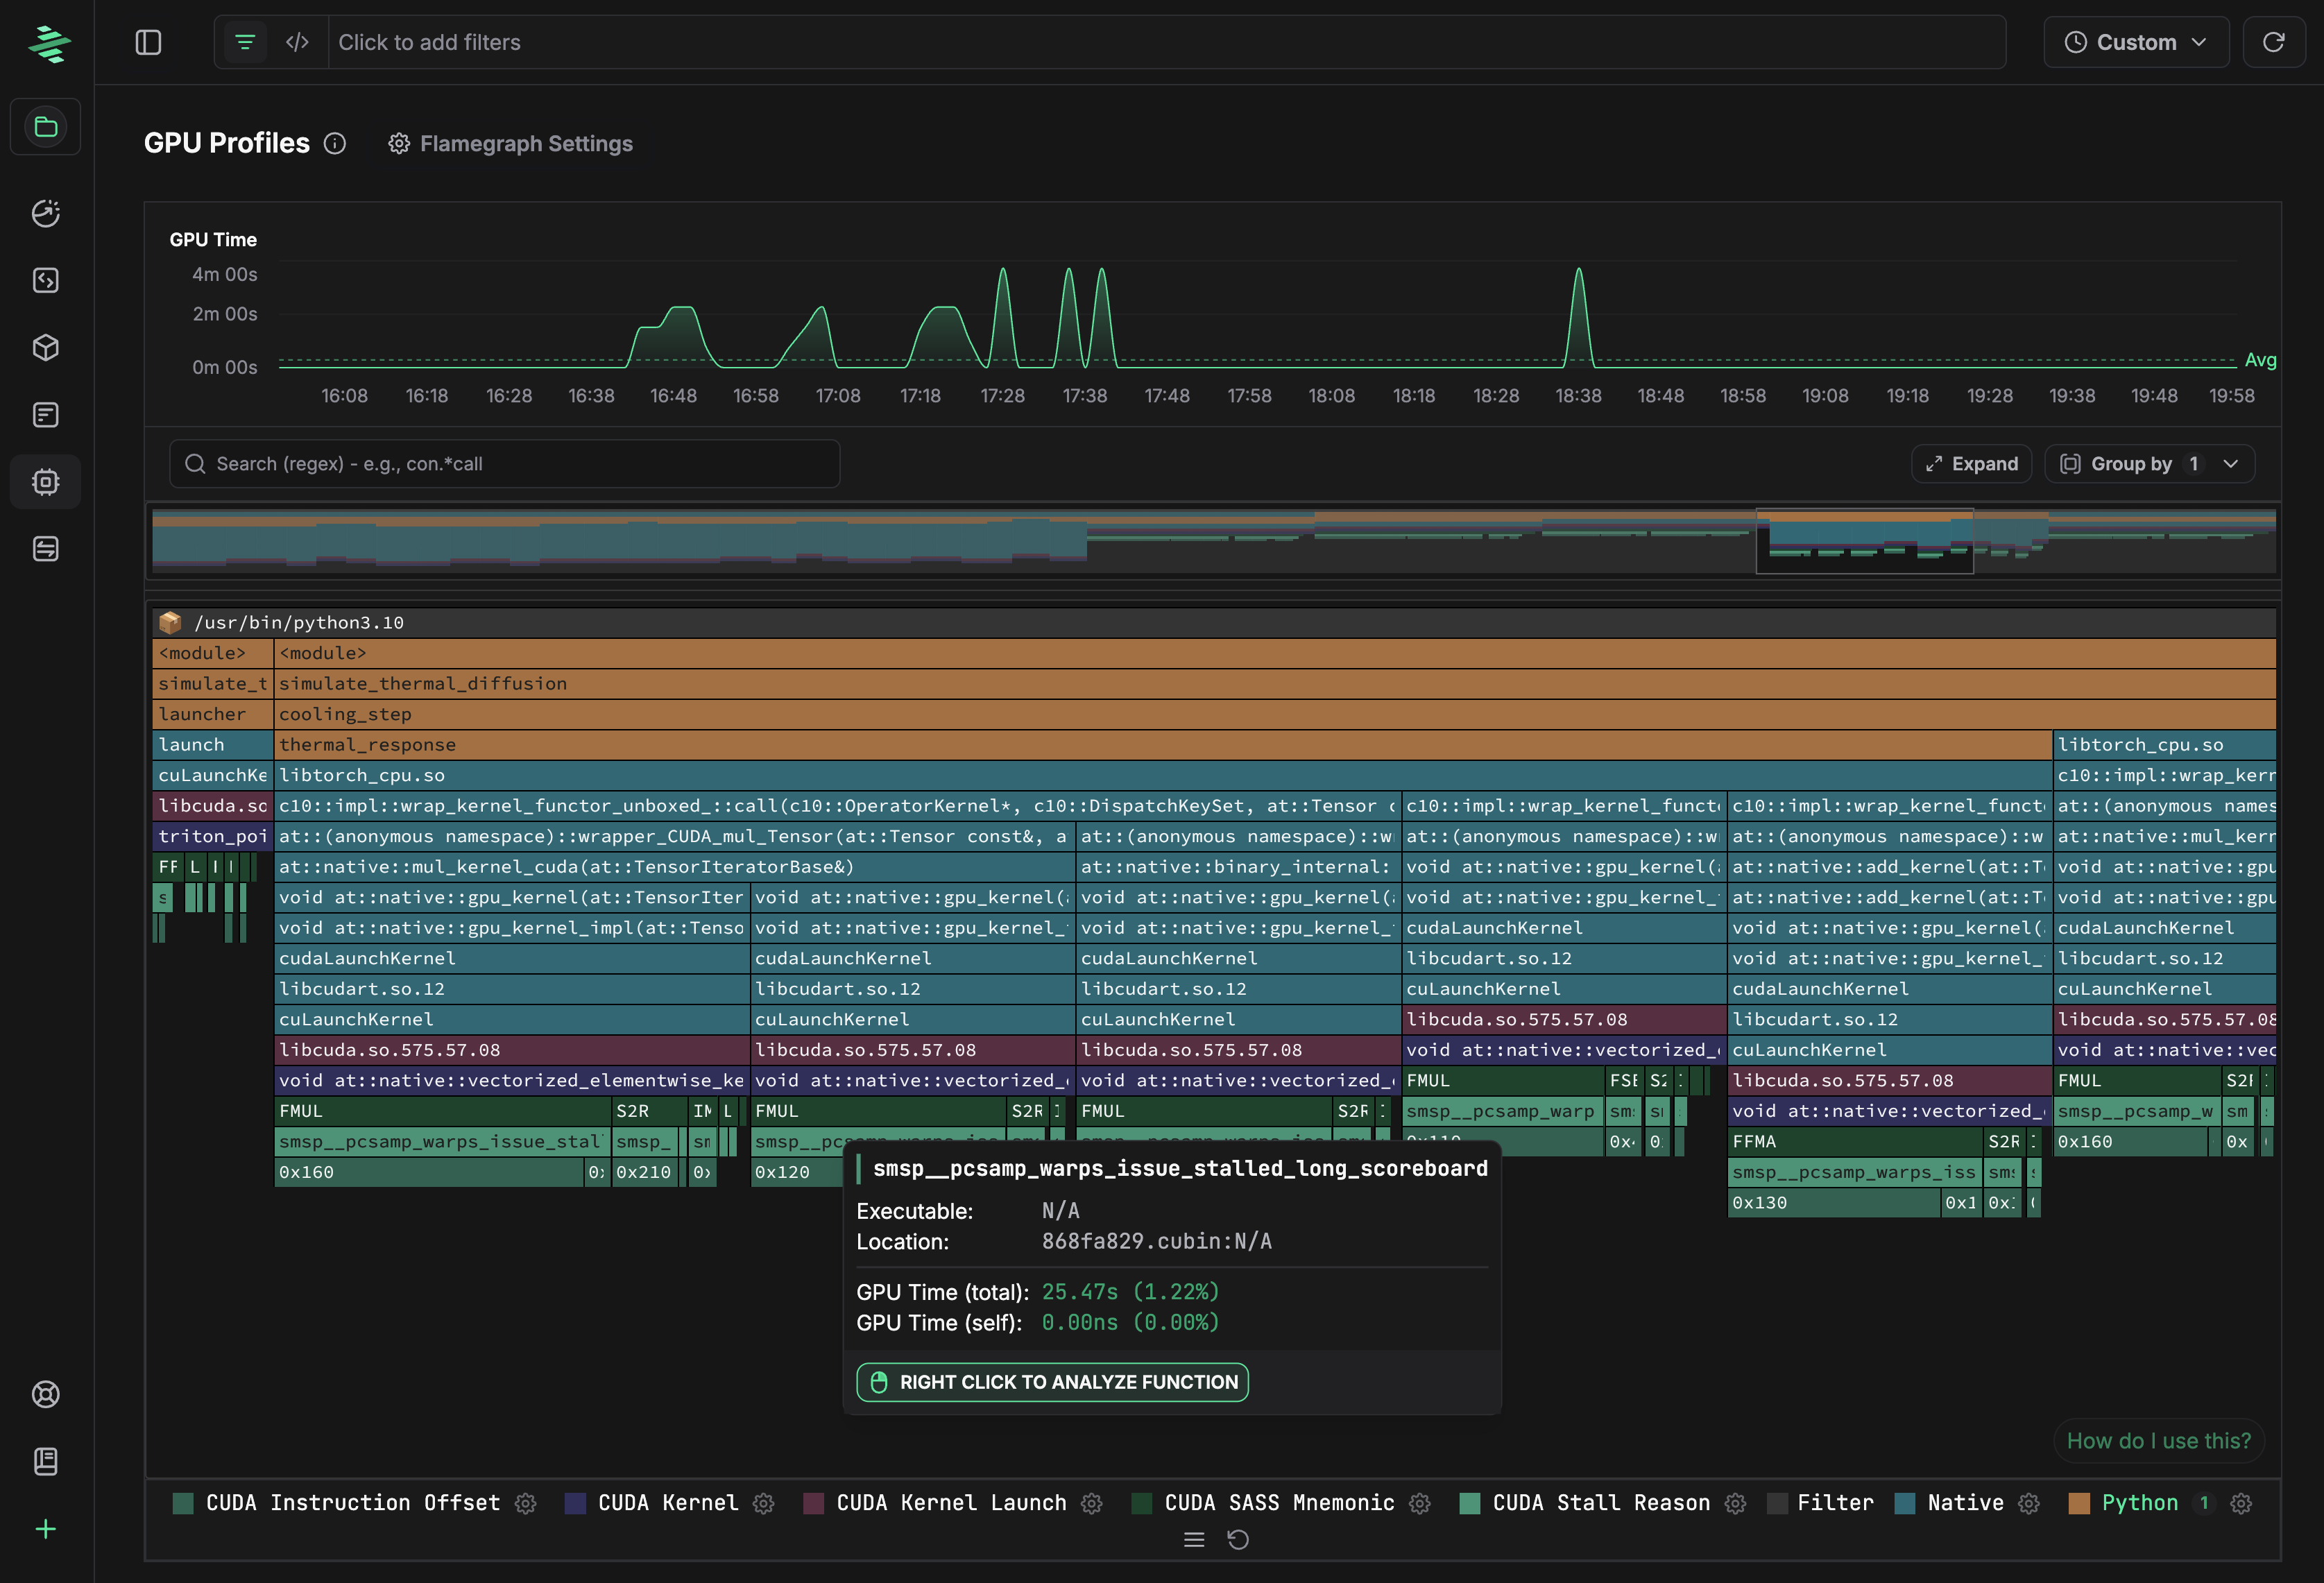 GPU flamegraph showing GPU kernel execution and memory operations
Interactive Controls
The flamegraph is fully interactive. Here are some of the controls we've built in. These controls are documented in the "How do I use this?" button in the bottom-right corner of the GPU and CPU flamegraph pages.
| Action | Control | Description |
|---|---|---|
| Pan | Drag with mouse or minimap | Move the entire graph view. |
| Pan Horizontally | Shift + Mouse Wheel | Scroll left or right along the X-axis. |
| Pan Vertically | Mouse Wheel | Scroll up or down through the call stack (Y-axis). |
| Zoom | Cmd/Ctrl + Mouse Wheel | Zoom in or out on the focused area. |
| Reset Zoom | Left-click empty space | Return to the initial unzoomed state. |
| Focus on Function | Left-click a node | Focus on a specific function. Clicking on a focused function also resets the zoom |
| Analyze Function | Right-click a node | Open the context menu for detailed analysis. |
Key Components
Flamegraph Settings
Flamegraph Settings controls how stack traces are displayed in the flamegraph and top functions views (sandwich view). These settings allow you to balance detail versus simplicity by collapsing repetitive frames, cleaning up function names, and filtering out noise.
By default, the flamegraph is simplified: successive unsymbolized frames and recursive calls are collapsed, libc functions show their common names (e.g., "write" instead of "__GI___libc_write"), etc. You can toggle these options to see more granular details when debugging specific issues, such as viewing frame addresses, enabling verbose function names, or separating collapsed frames.
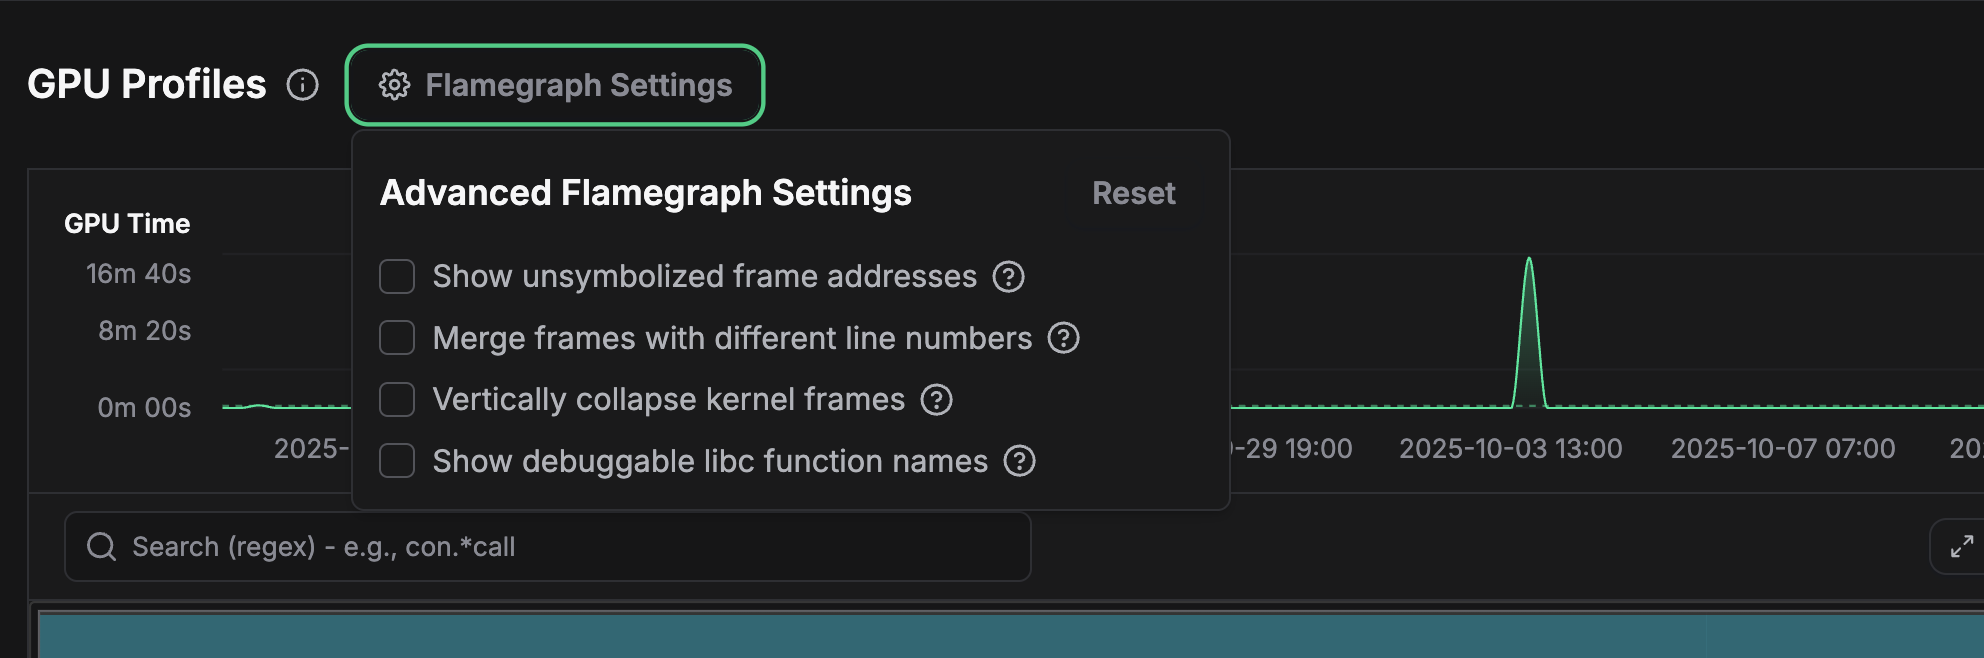 Flamegraph settings
CPU % Mode — Absolute vs. Relative
The CPU % Mode toggle switches between two visualization modes.
- Abs (Absolute) — Displays real CPU usage percentages, similar to
btop. - Rel (Relative) — Displays CPU usage relative to other profiled workloads.
See Unit Reference for additional details.
The CPU % Mode toggle is not available on GPU profile flamegraphs because GPU profiles use relative times.
Search
Use the search bar to quickly locate functions of interest.
-
Basic search — Type a function name directly, for example:
calculateDiffusion -
Regex search — Use regular expressions for pattern-based matching:
^con.*Call$     // matches functions starting with "con" and ending with "Call"
java.*Thread   // matches Java thread-related functions
.*numpy.*      // matches NumPy library functions
Group By
The Group By dropdown organizes flamegraph data along different dimensions:
- Main Executable (default) — Groups by the primary process executable.
- Script Name — Groups by application script name (currently supported for Python).
- Host — Groups by individual machines.
- Thread — Groups by process threads.
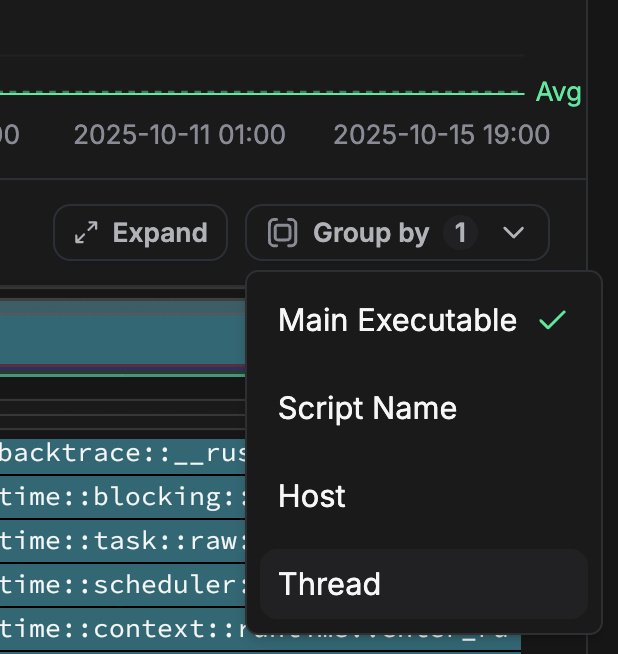 Grouping flamegraph
Mirror Section (Mini-map)
The mirror section shows a miniature overview of the entire flamegraph. Click and drag within it to navigate quickly to different regions of the graph.
Interactive Legend
The legend at the bottom shows color mappings for frame types (languages or runtimes).
The legend is interactive — click a frame type to hide or show it, helping reduce visual noise.
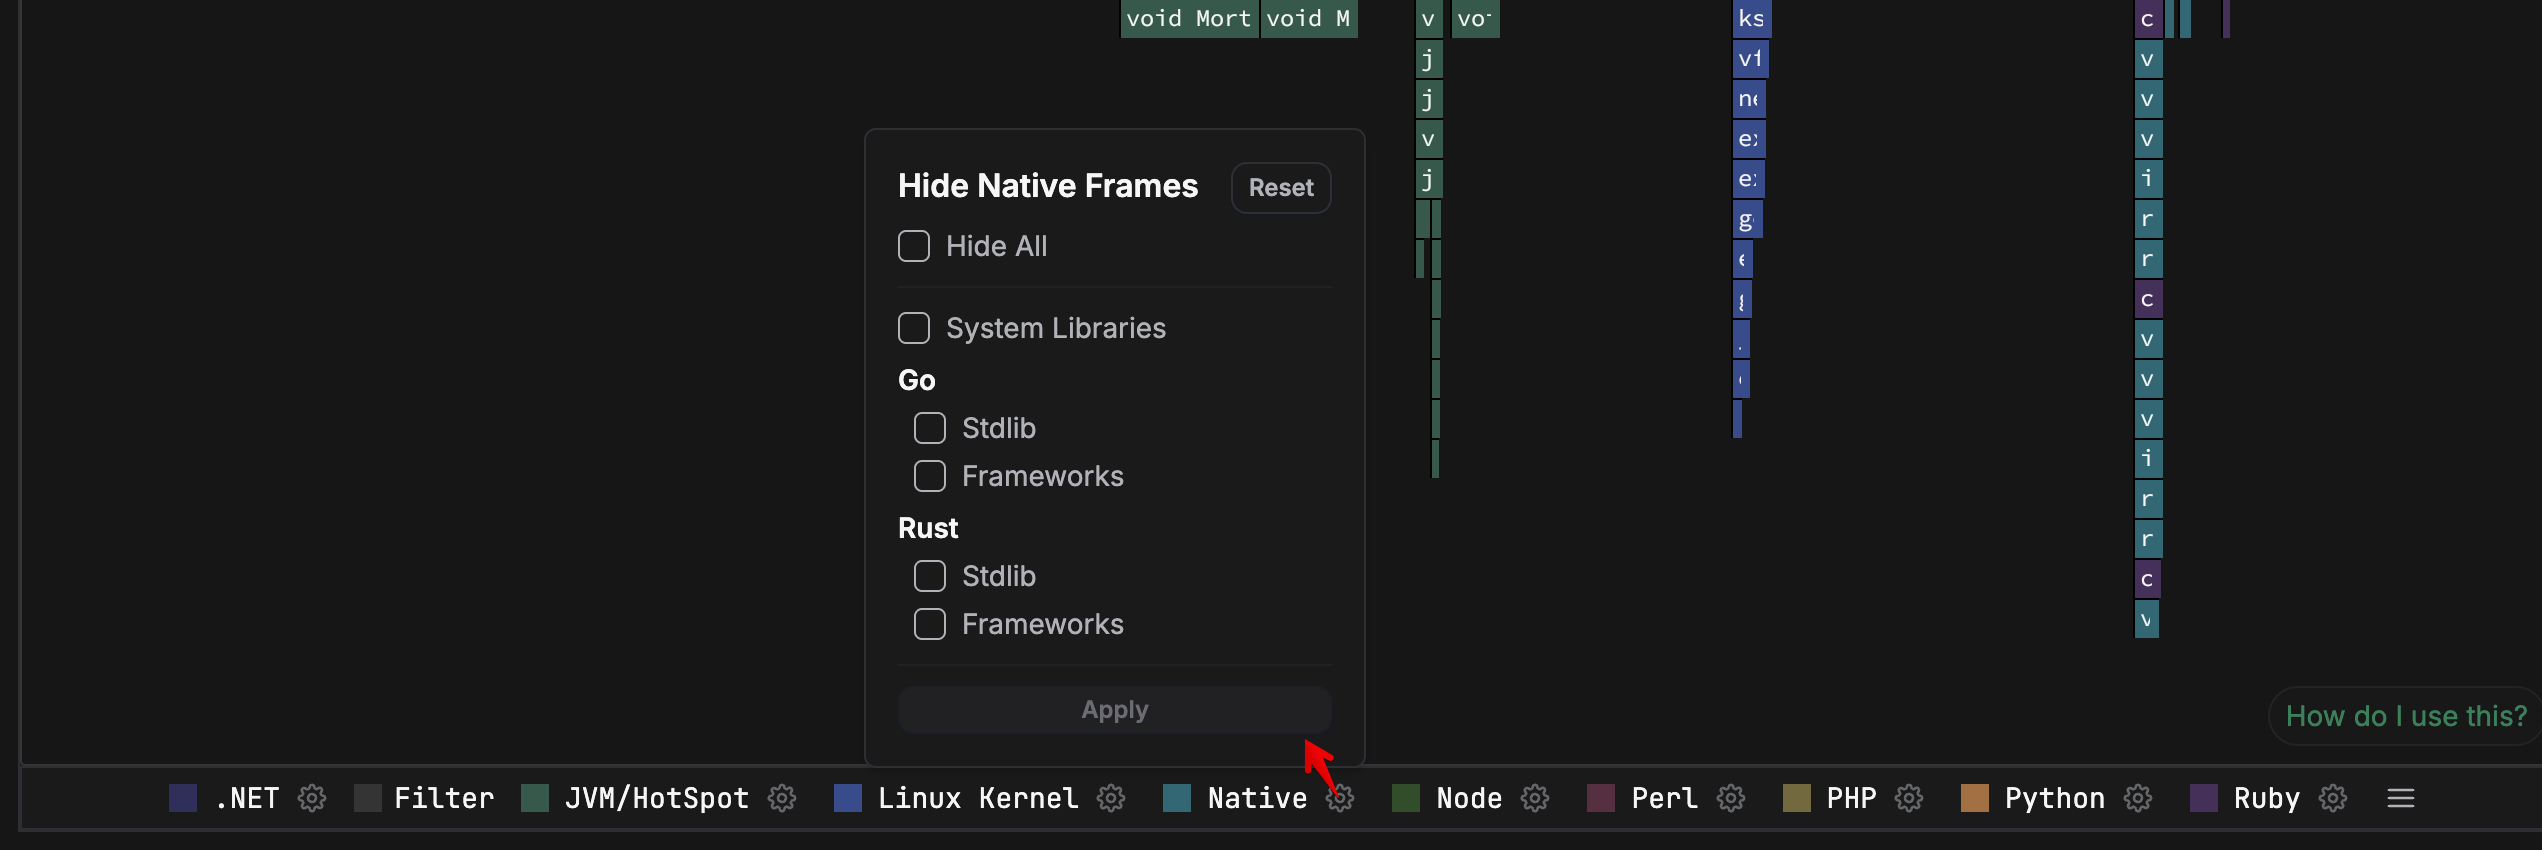 Flamegraph legend