AMD GPU Metrics & Profiles
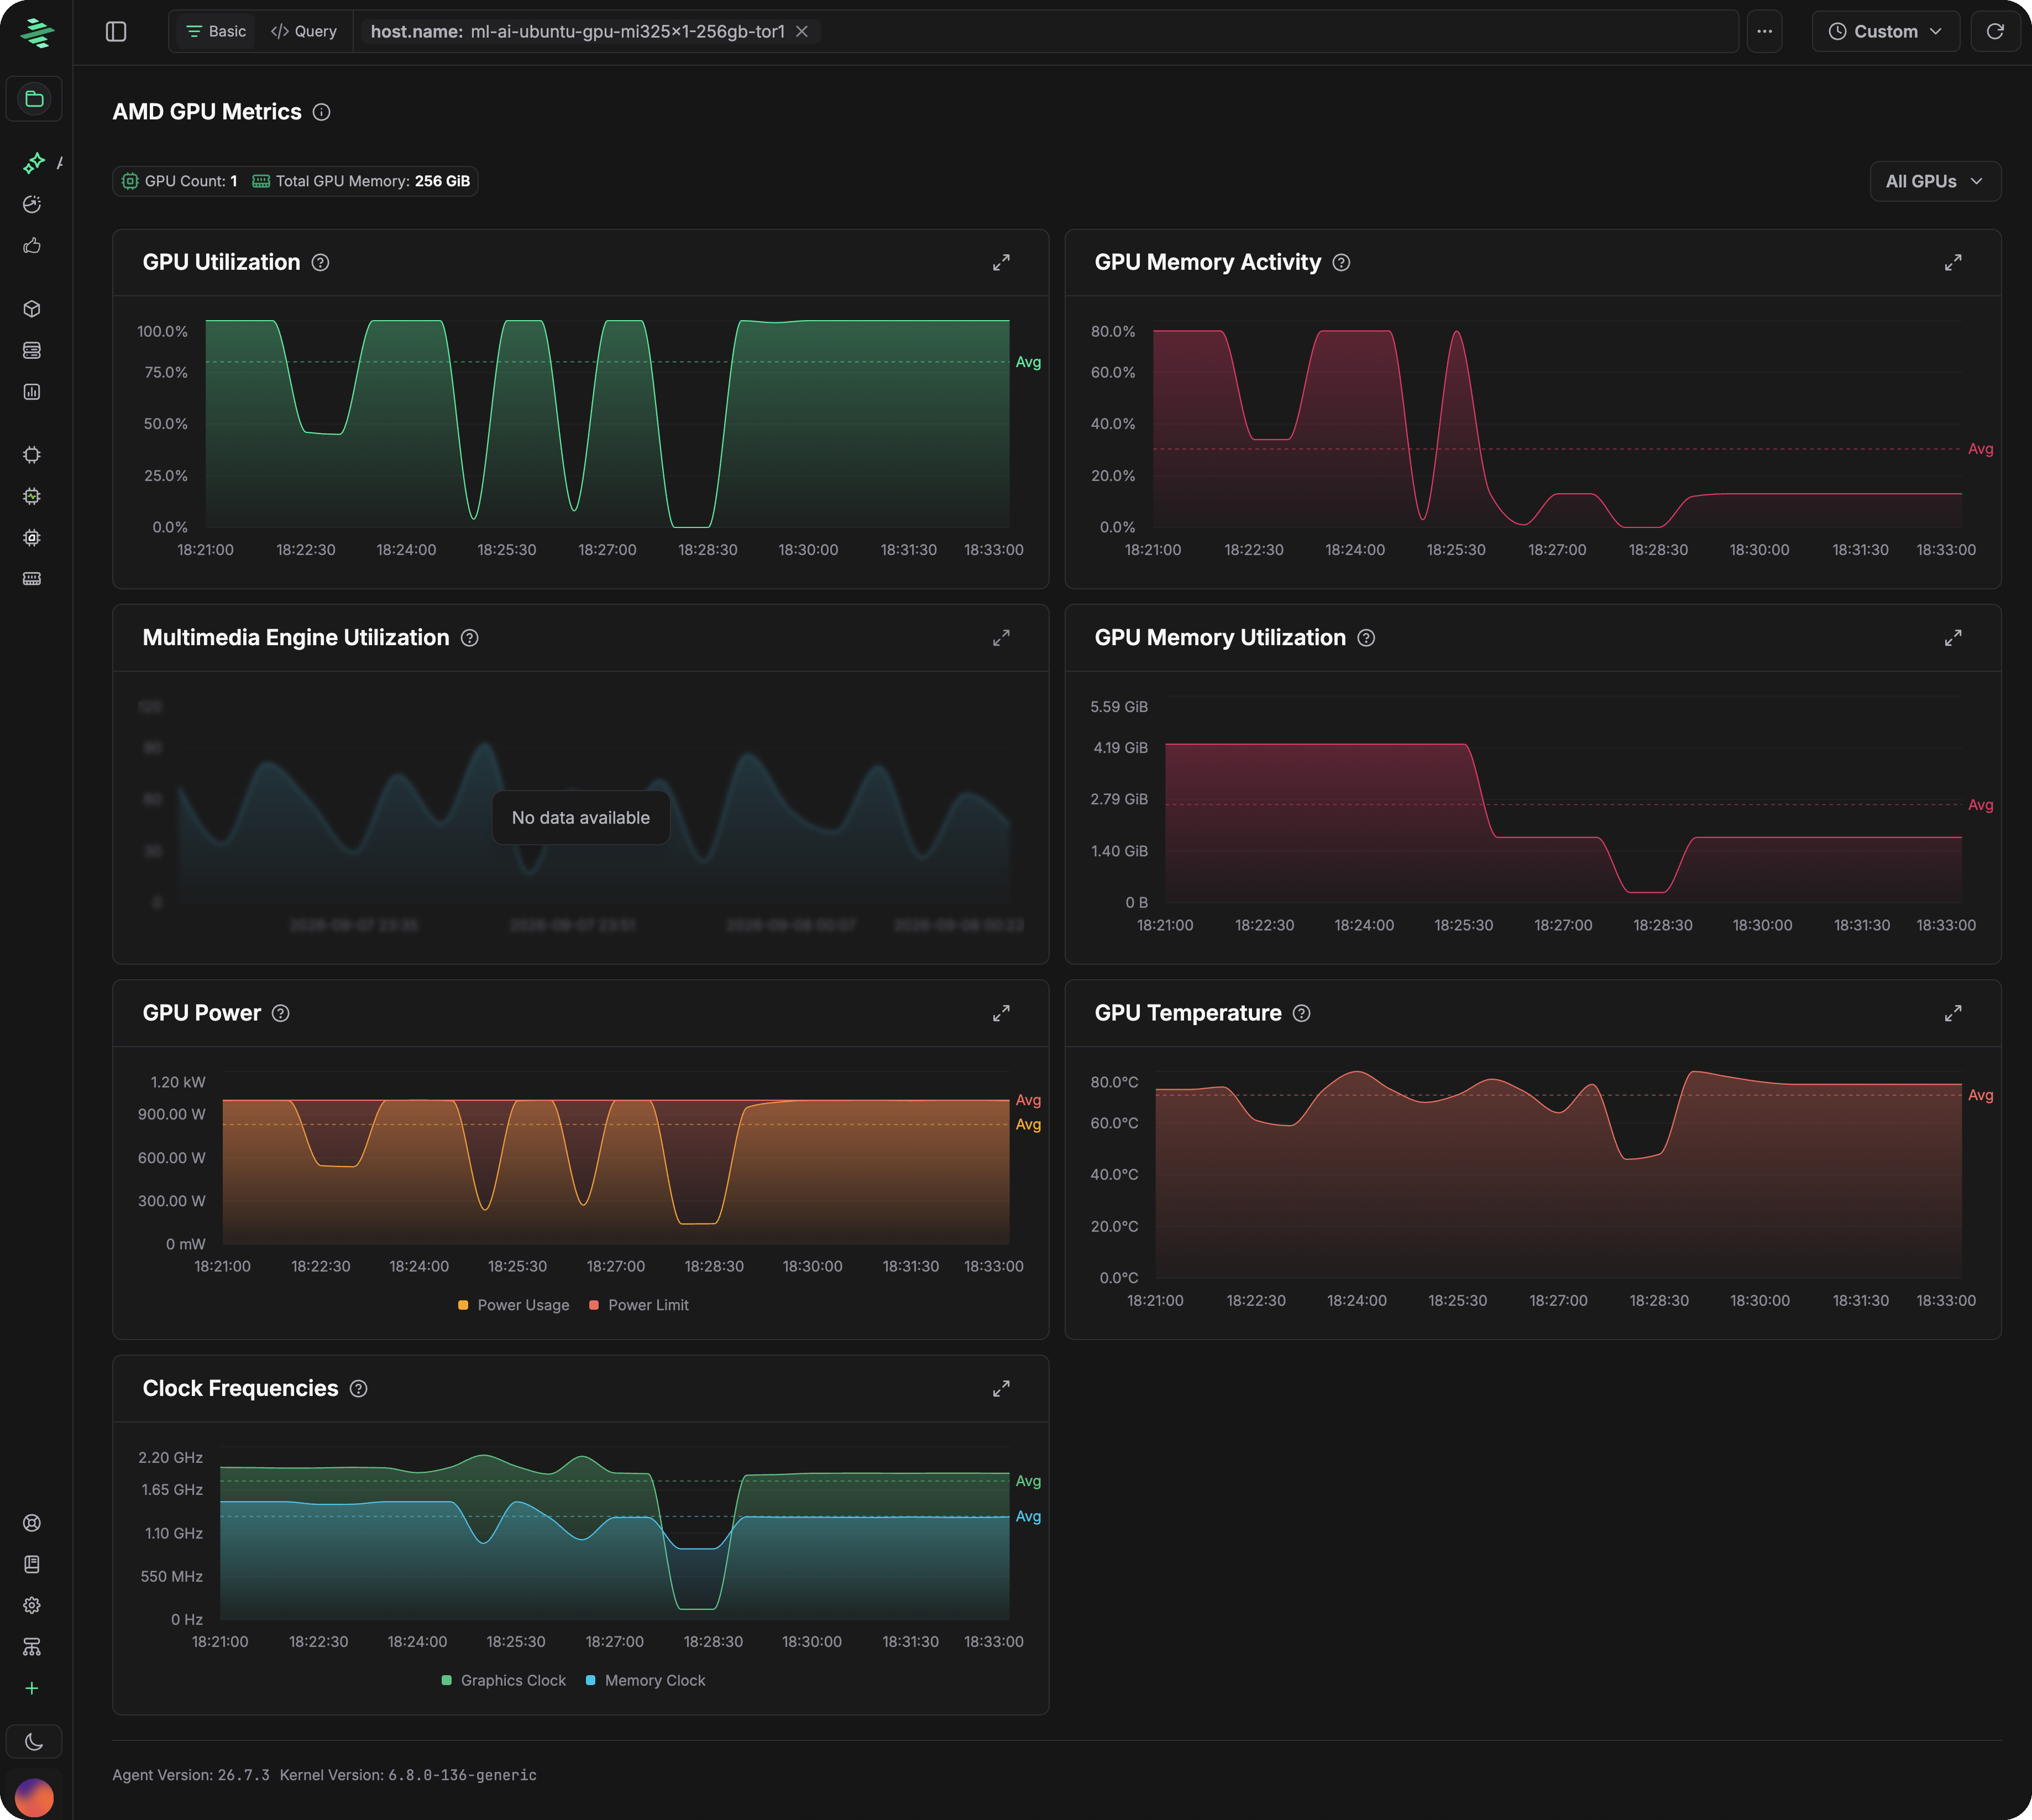
AMD GPU metrics provide host-wide visibility into accelerator utilization, memory activity, power, temperature, and clocks. Use these metrics to identify an interesting host, device, or time window, then open the corresponding ROCm flamegraph to see the HIP kernels and CPU call stacks behind it.
- Metrics reveal trends and resource bottlenecks.
- Profiling attributes device time to HIP kernels, memory operations, synchronization, ROCTX ranges, and the CPU stacks that launched them.
Requirements
- An x86_64 host using the
amdgpukernel driver - A ROCm workload (ROCm 7.x or above)
- The zymtrace profiler running on the host with GPU support enabled by your license
- AMD SMI available to the profiler for metrics collection
libdrm_amdgpu.so.1available for GPU names, memory metrics, and driver information
The profiler searches standard library paths automatically. Use -amdsmi-path=/path/to/libamd_smi.so or -libdrm-path=/path/to/libdrm_amdgpu.so.1 only when the libraries are installed elsewhere.
Enabling AMD GPU profiling
The profiler ships the ROCprofiler SDK and the zymtrace ROCm tool library. Start each ROCm workload with these environment variables so ROCprofiler loads the tool when the process starts:
ROCP_TOOL_LIBRARIES=/opt/zymtrace/profiler/libzymtracerocmprofiler.so
ROCPROFILER_REGISTER_LIBRARY=/opt/zymtrace/profiler/librocprofiler-sdk.so.1
For a containerized workload, mount the profiler's shared host directory and set both variables:
docker run \
  -v /var/lib/zymtrace/profiler:/opt/zymtrace/profiler:ro \
  -e ROCP_TOOL_LIBRARIES=/opt/zymtrace/profiler/libzymtracerocmprofiler.so \
  -e ROCPROFILER_REGISTER_LIBRARY=/opt/zymtrace/profiler/librocprofiler-sdk.so.1 \
  your-gpu-image
AMD profiling cannot attach to an already-running GPU process: the environment variables must be present when the ROCm process starts. The Add Data flow in the zymtrace UI generates deployment-specific Docker, Helm, and binary commands.
See the GPU Profiler Environment Variables AMD tab for the complete reference of ZYMTRACE_ROCMPROFILER__* tuning variables.
Available AMD GPU metrics
| Metric | Description | Unit |
|---|---|---|
hw.amd_gpu.utilization | GPU engine utilization | % |
hw.amd_gpu.memory.activity | Memory-controller activity | % |
hw.amd_gpu.multimedia.utilization | Multimedia engine utilization | % |
hw.amd_gpu.memory.utilization | VRAM currently in use | bytes |
hw.amd_gpu.power | Current power usage | mW |
hw.amd_gpu.power_limit | Configured power limit | mW |
hw.amd_gpu.temp | GPU edge temperature, when the ASIC exposes an edge sensor | °C |
hw.amd_gpu.clock.graphics | Current graphics clock | MHz |
hw.amd_gpu.clock.mem | Current memory clock | MHz |
Metric availability depends on the GPU and AMD SMI support for that ASIC. Without libdrm, activity, power, temperature, and clock metrics can still be available, but GPU names, memory metrics, and driver information are unavailable.
See the Metrics Reference for each metric's type, aggregation, and the chart it drives.
Drilling down from metrics into ROCm profiles
Metrics, profiles, and CPU code are one connected workflow, not separate views. A typical investigation moves through three levels:
- Metrics. Navigate to Top Entities, select an AMD GPU host, and inspect its metrics dashboard. A utilization, memory, power, temperature, or clock anomaly identifies the interesting device and time window. Clicking that data point scopes the analysis to it.
- ROCm profiles. From the data point, open the ROCm flamegraph for that exact window. GPU time is broken down by HIP kernel, joined to the complete CPU call path that launched each one, from the application's Python frames through the framework and math libraries down to the kernel dispatch.
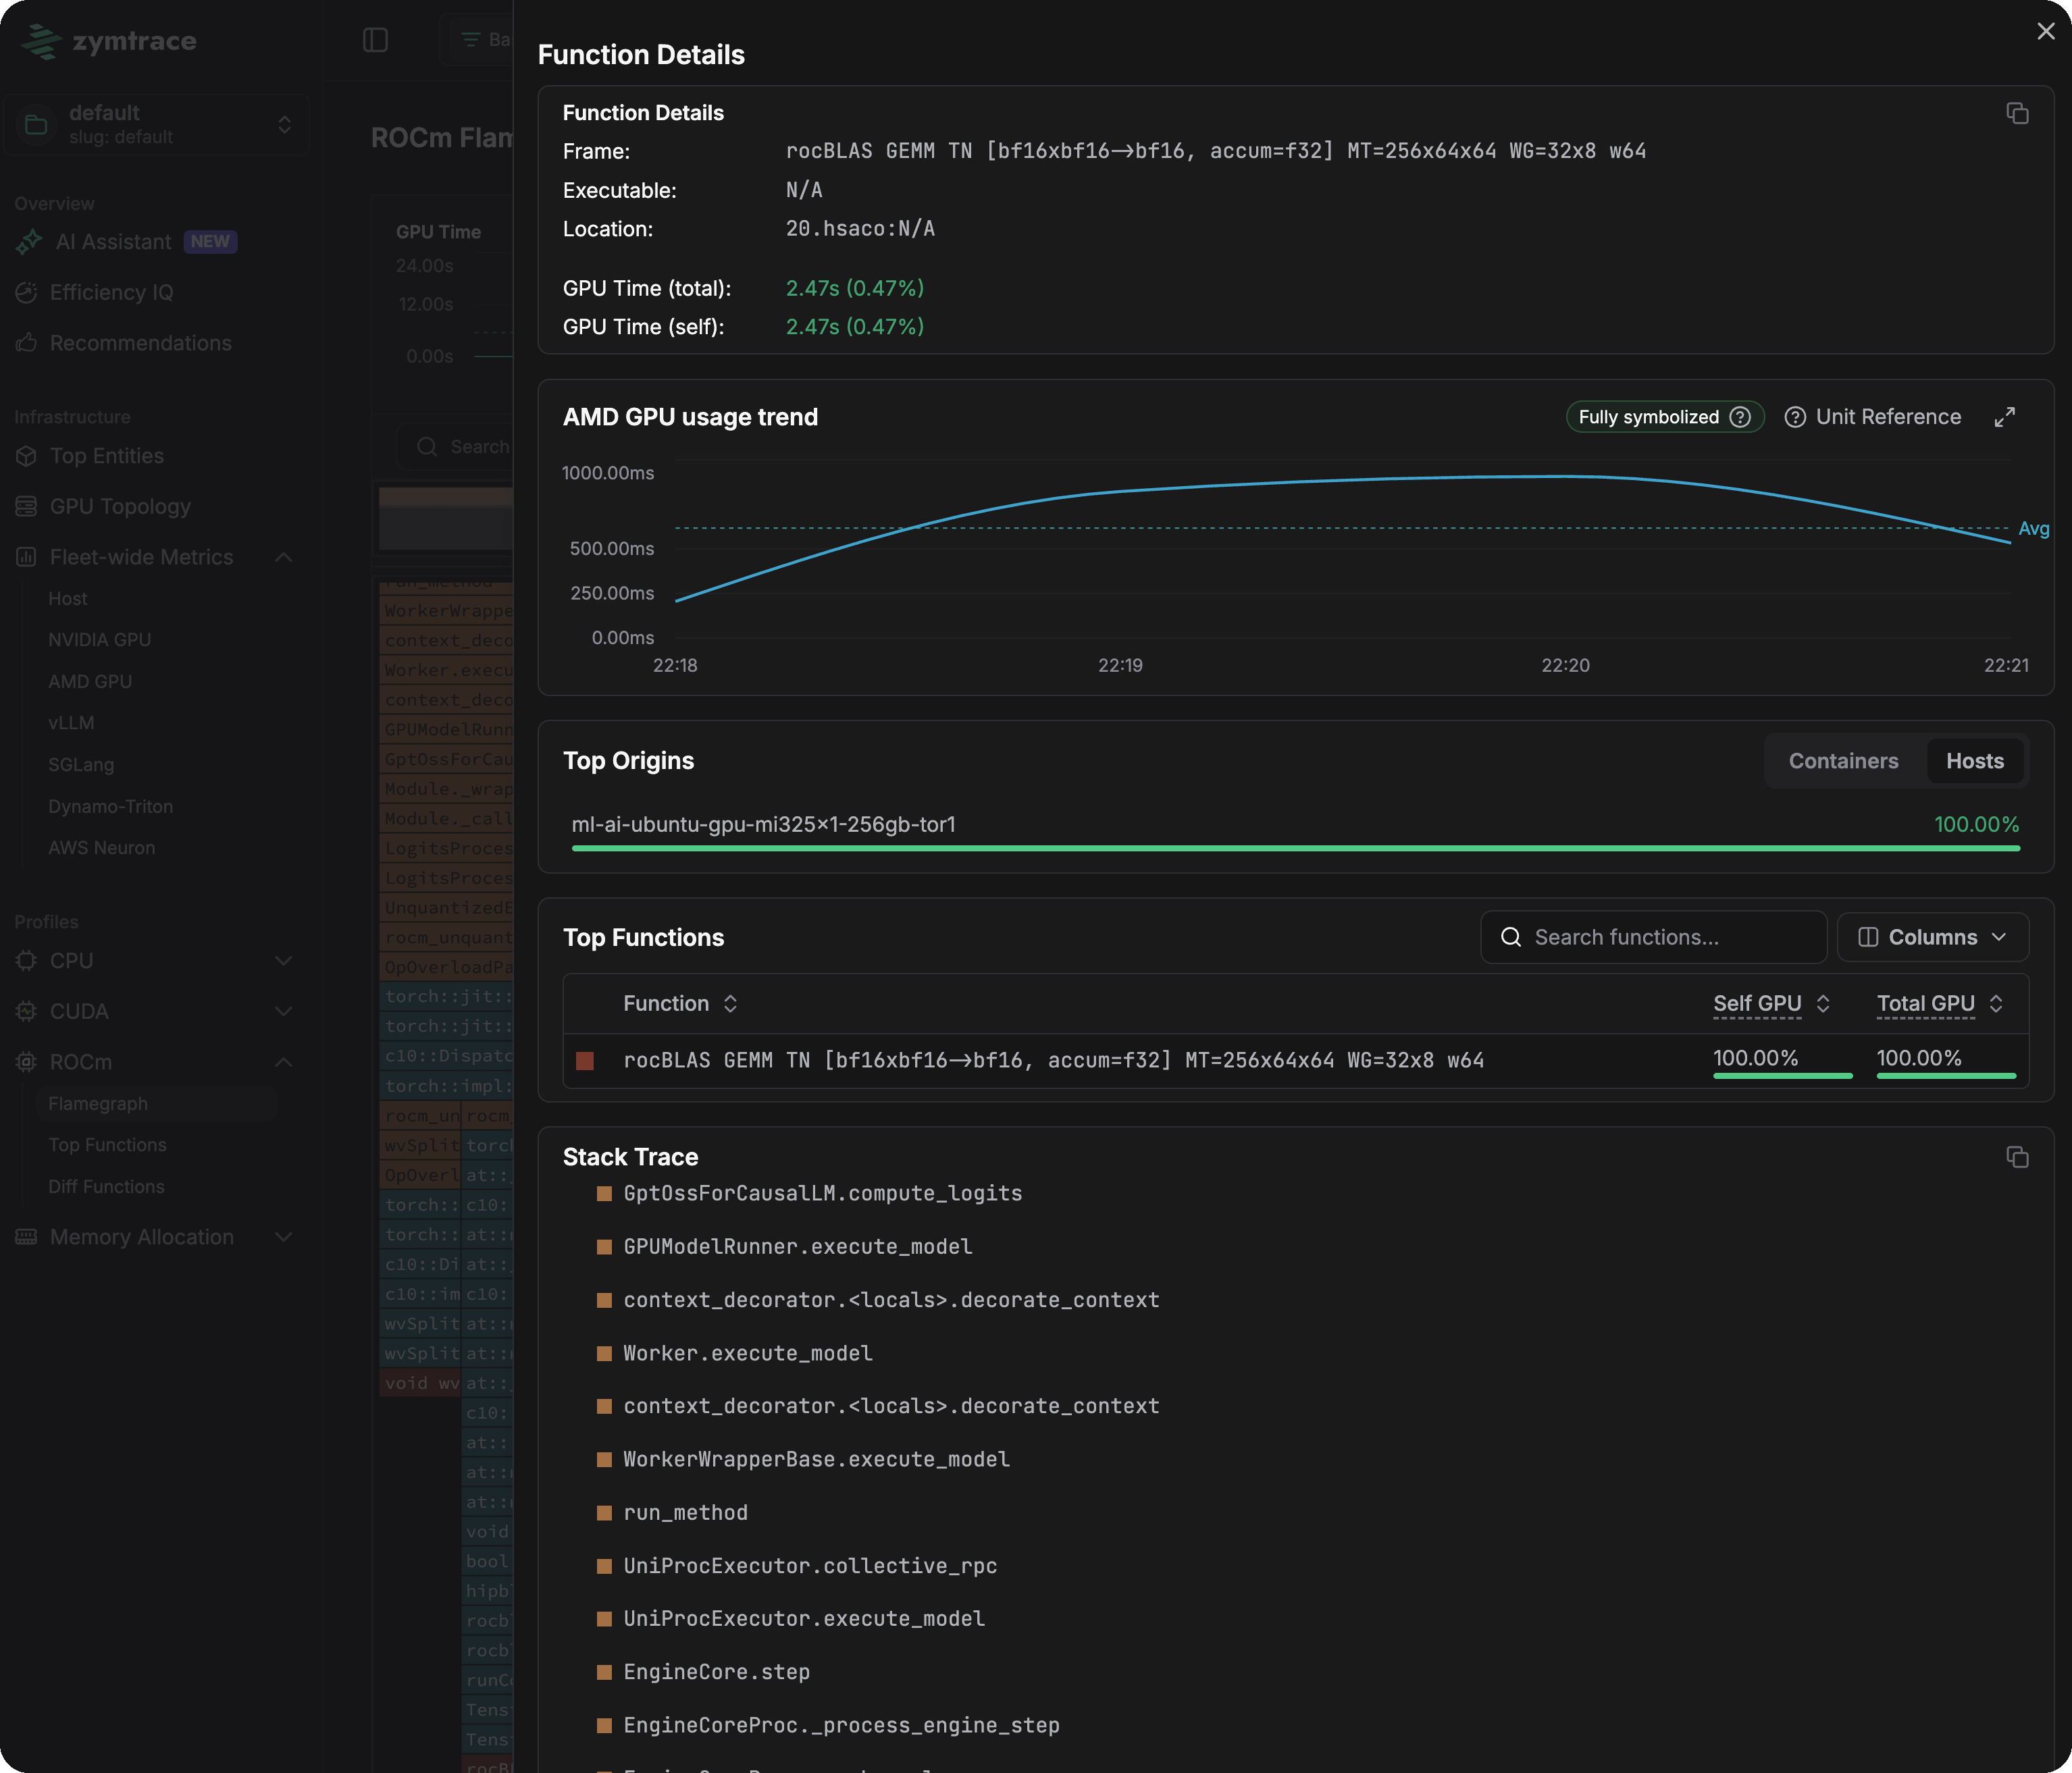
- The kernel and its launching CPU code. Selecting a kernel frame opens its function details: the fully symbolized kernel name, its GPU time and share, its usage trend, the hosts it ran on, and the full CPU stack trace that launched it.
ROCm flamegraphs can contain:
rocmframes for HIP kernel dispatchesrocm-memoryframes for memory copies and fillsrocm-syncframes for synchronization operationsrocm-roctxframes for ROCTX ranges
Profiles retain the GPU, stream, host process, and thread identity and are joined to the CPU stack that submitted the operation.
Example: vLLM GPT-OSS on an MI325X
Level 1: metrics. The dashboard for an MI325X host serving vLLM GPT-OSS shows utilization, memory, power, temperature, and clock behavior. Any of these charts is a click away from the profile view for the same device and time window.
Level 2: the ROCm flamegraph. GPU time is attributed through the full launch path: the vLLM engine's Python frames (EngineCore.step, GPUModelRunner.execute_model), the PyTorch dispatcher, the rocBLAS/hipBLASLt stack (hipblasLtMatmul, rocblaslt_matmul, TensileLite::hip::SolutionAdapter::launchKernels), and finally the HIP kernels executing on the device. Every kernel sits directly under the CPU code that launched it.
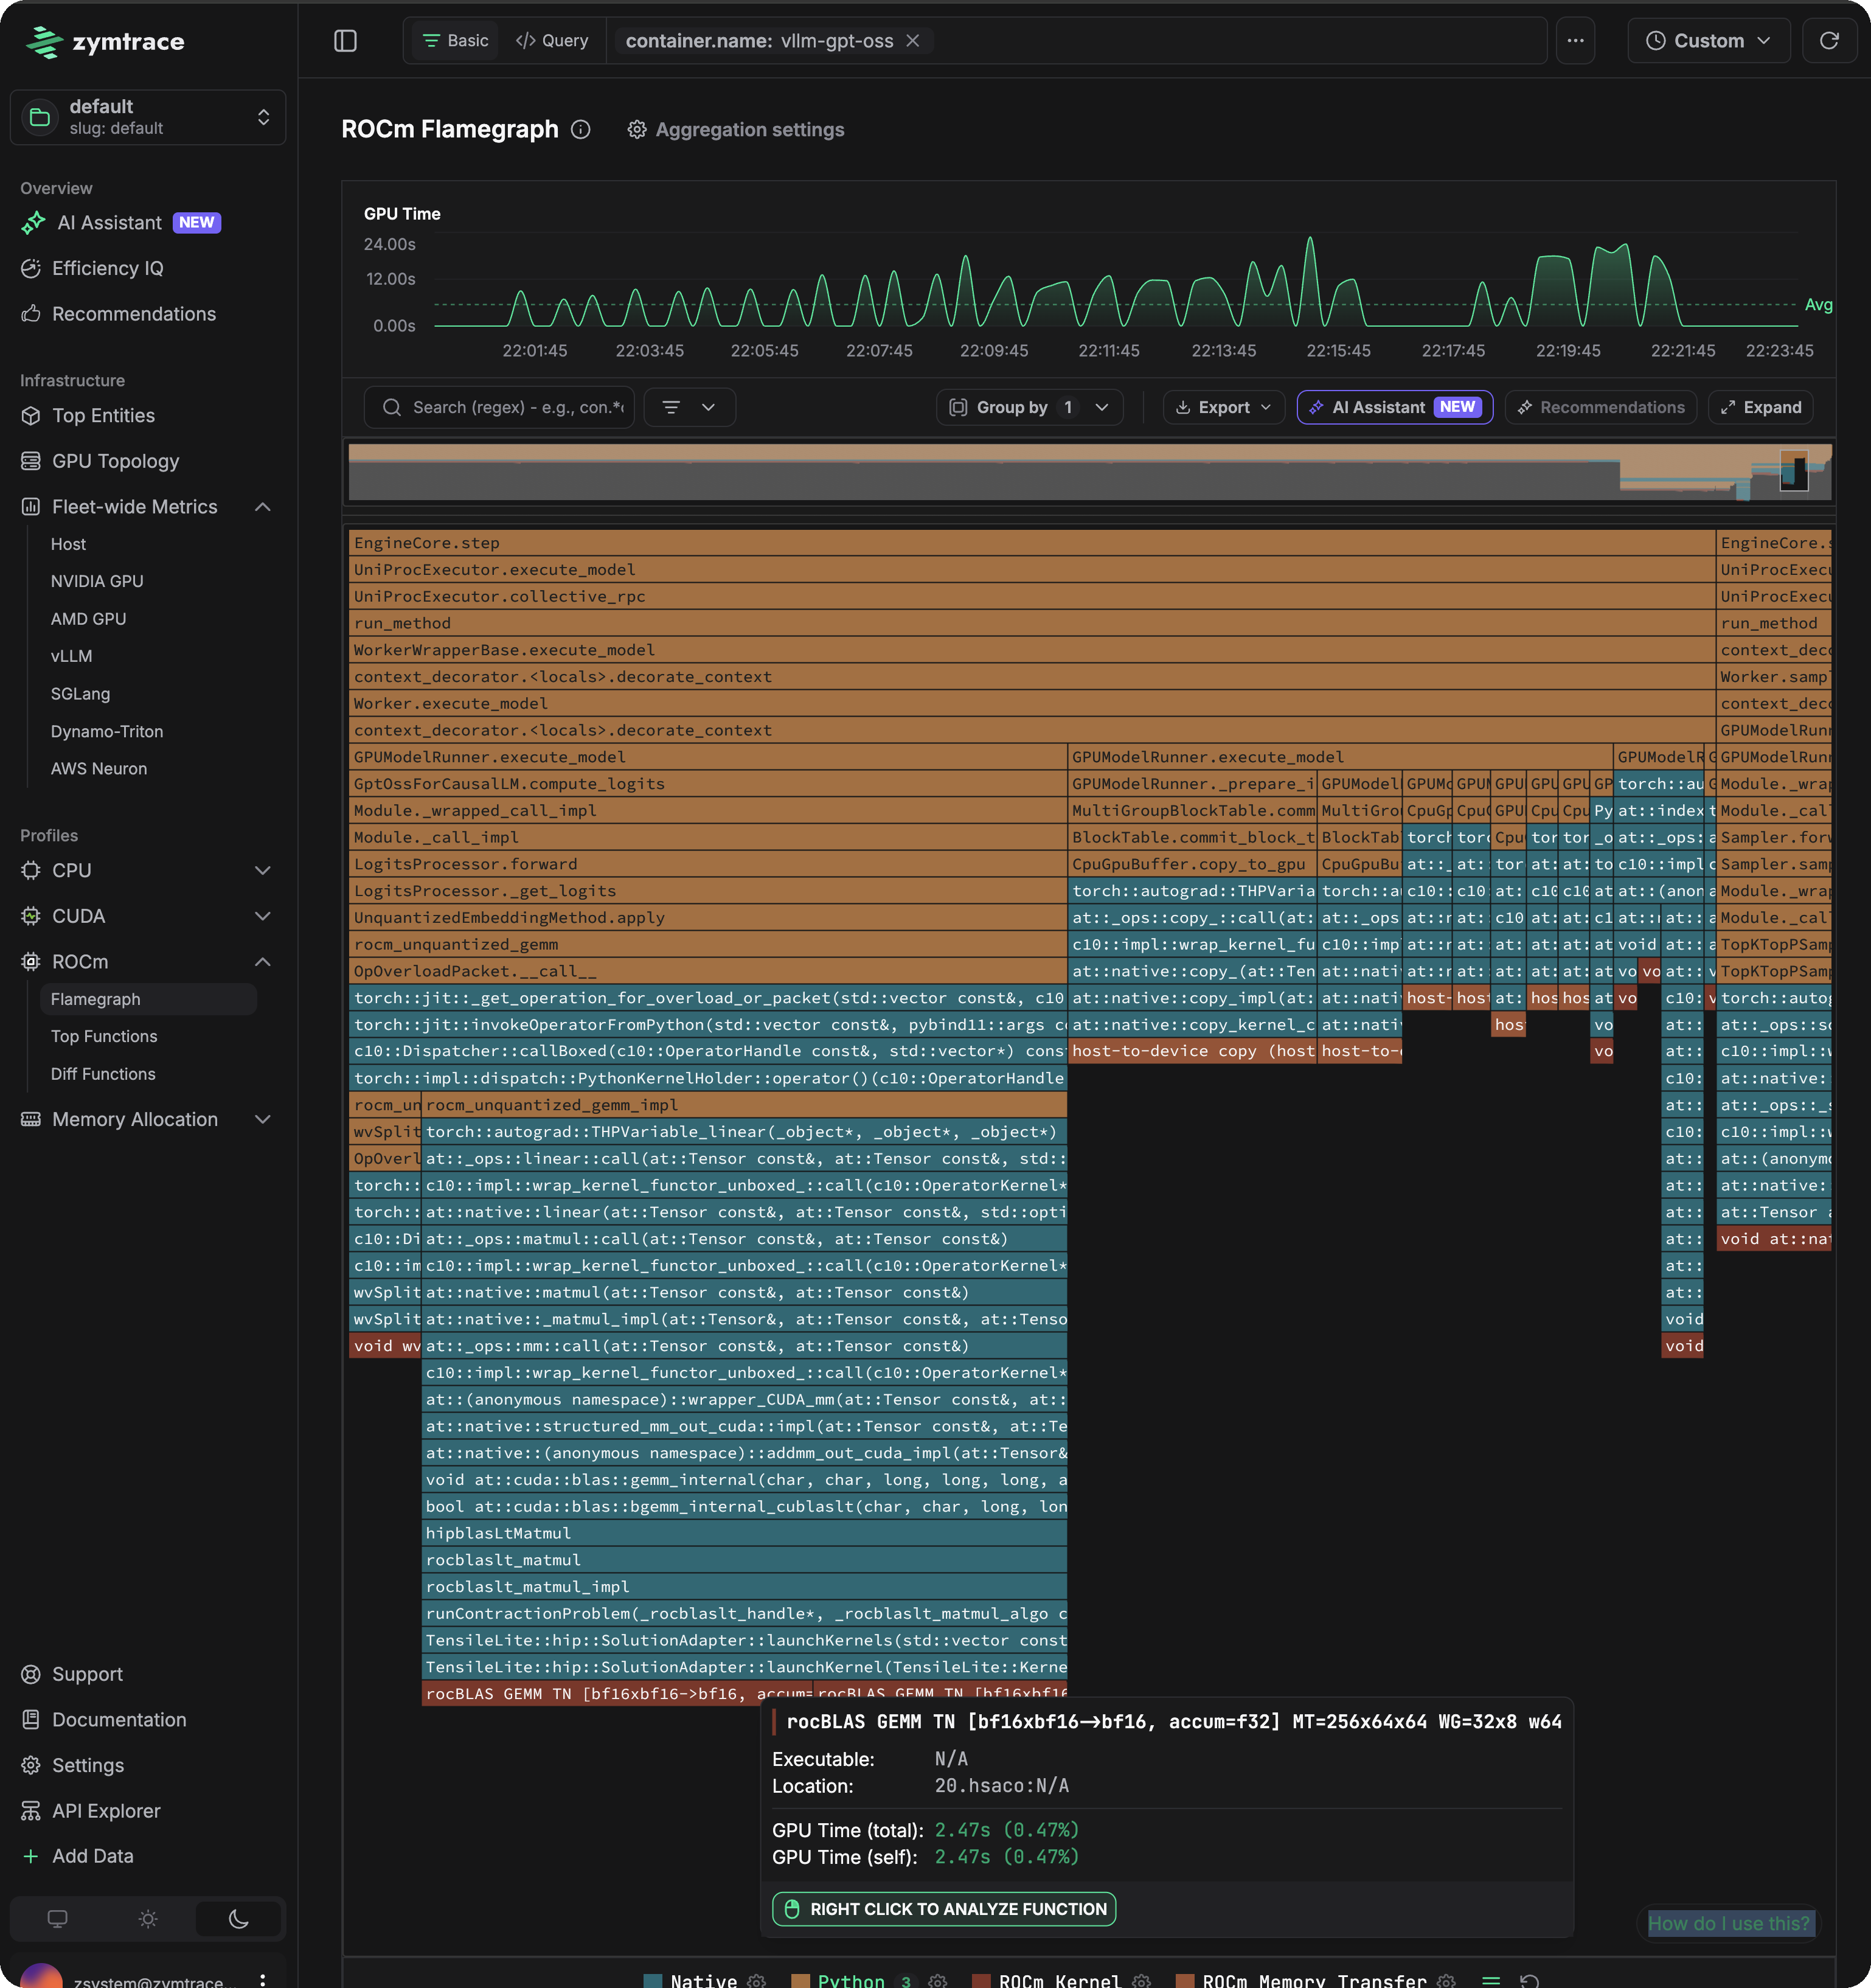
Level 3: the kernel. Selecting a kernel frame opens its function details. Here the kernel is the rocBLAS GEMM, shown with its fully symbolized name:
rocBLAS GEMM TN [bf16xbf16→bf16, accum=f32] MT=256x64x64 WG=32x8 w64
That one name tells you the transpose configuration (TN), the data types (BF16 inputs and output with FP32 accumulation), the macro-tile size (MT=256x64x64), and the workgroup shape (WG=32x8, wave64). The details panel adds the kernel's GPU time and share, its AMD GPU usage trend over the selected window, the hosts it ran on, and the complete CPU stack trace that launched it, from EngineCore.step at the top of the vLLM engine down to the dispatch: the exact application code responsible for the device time.
Roadmap
zymtrace is building AMD GPU support toward full parity with its NVIDIA capabilities. The following are on the roadmap for AMD GPUs:
- Per-process GPU utilization and memory metrics
- PCIe, NVLink or xGMI throughput metrics
- ECC, SM efficiency, occupancy, and Tensor Core metrics
- MIG-aware profiling
- Instruction-level PC sampling, ISA attribution, and stall reasons
- High-resolution GPU timeline
- AI recommendations for GPU profiles