NVIDIA GPU Metrics
GPU metrics complement profiles by providing high-level visibility into GPU performance, resource utilization, and hardware health. Use metrics to form hypotheses about performance issues, then dive deeper with GPU profiling for detailed analysis:
- Metrics help you form hypotheses by revealing performance trends and identifying potential bottlenecks
- Profiling provides detailed CUDA kernel-level analysis to validate hypotheses and pinpoint optimization opportunities
Together, they enable a complete GPU performance analysis workflow from hypothesis formation to detailed optimization.
Metrics are designed for monitoring purposes. If you need deep visibility into your code and how efficiently it runs on GPUs, use profiling. A typical workflow is to start from an interesting data point on high or low power or memory consumption, click on it, and navigate to the corresponding GPU profiles for detailed analysis.
Note that Tensor Core, SM Efficiency, and SM Occupancy metrics are only available on data center GPUs such as H100s and H200s.
Enabling GPU Metrics
GPU metrics collection is enabled by default, so no --enable-gpu-metrics flag is required. On NVIDIA hosts, the profiler also needs to locate the NVML library: add --nvml-auto-scan to detect it automatically, or --nvml-path=/path/to/libnvidia-ml.so if you know the exact path. See the installation guide for Helm, Docker, binary, and systemd instructions.
To turn metrics collection off, set -enable-gpu-metrics=false. See Profiler ENV & CLI Args.
Available GPU Metrics
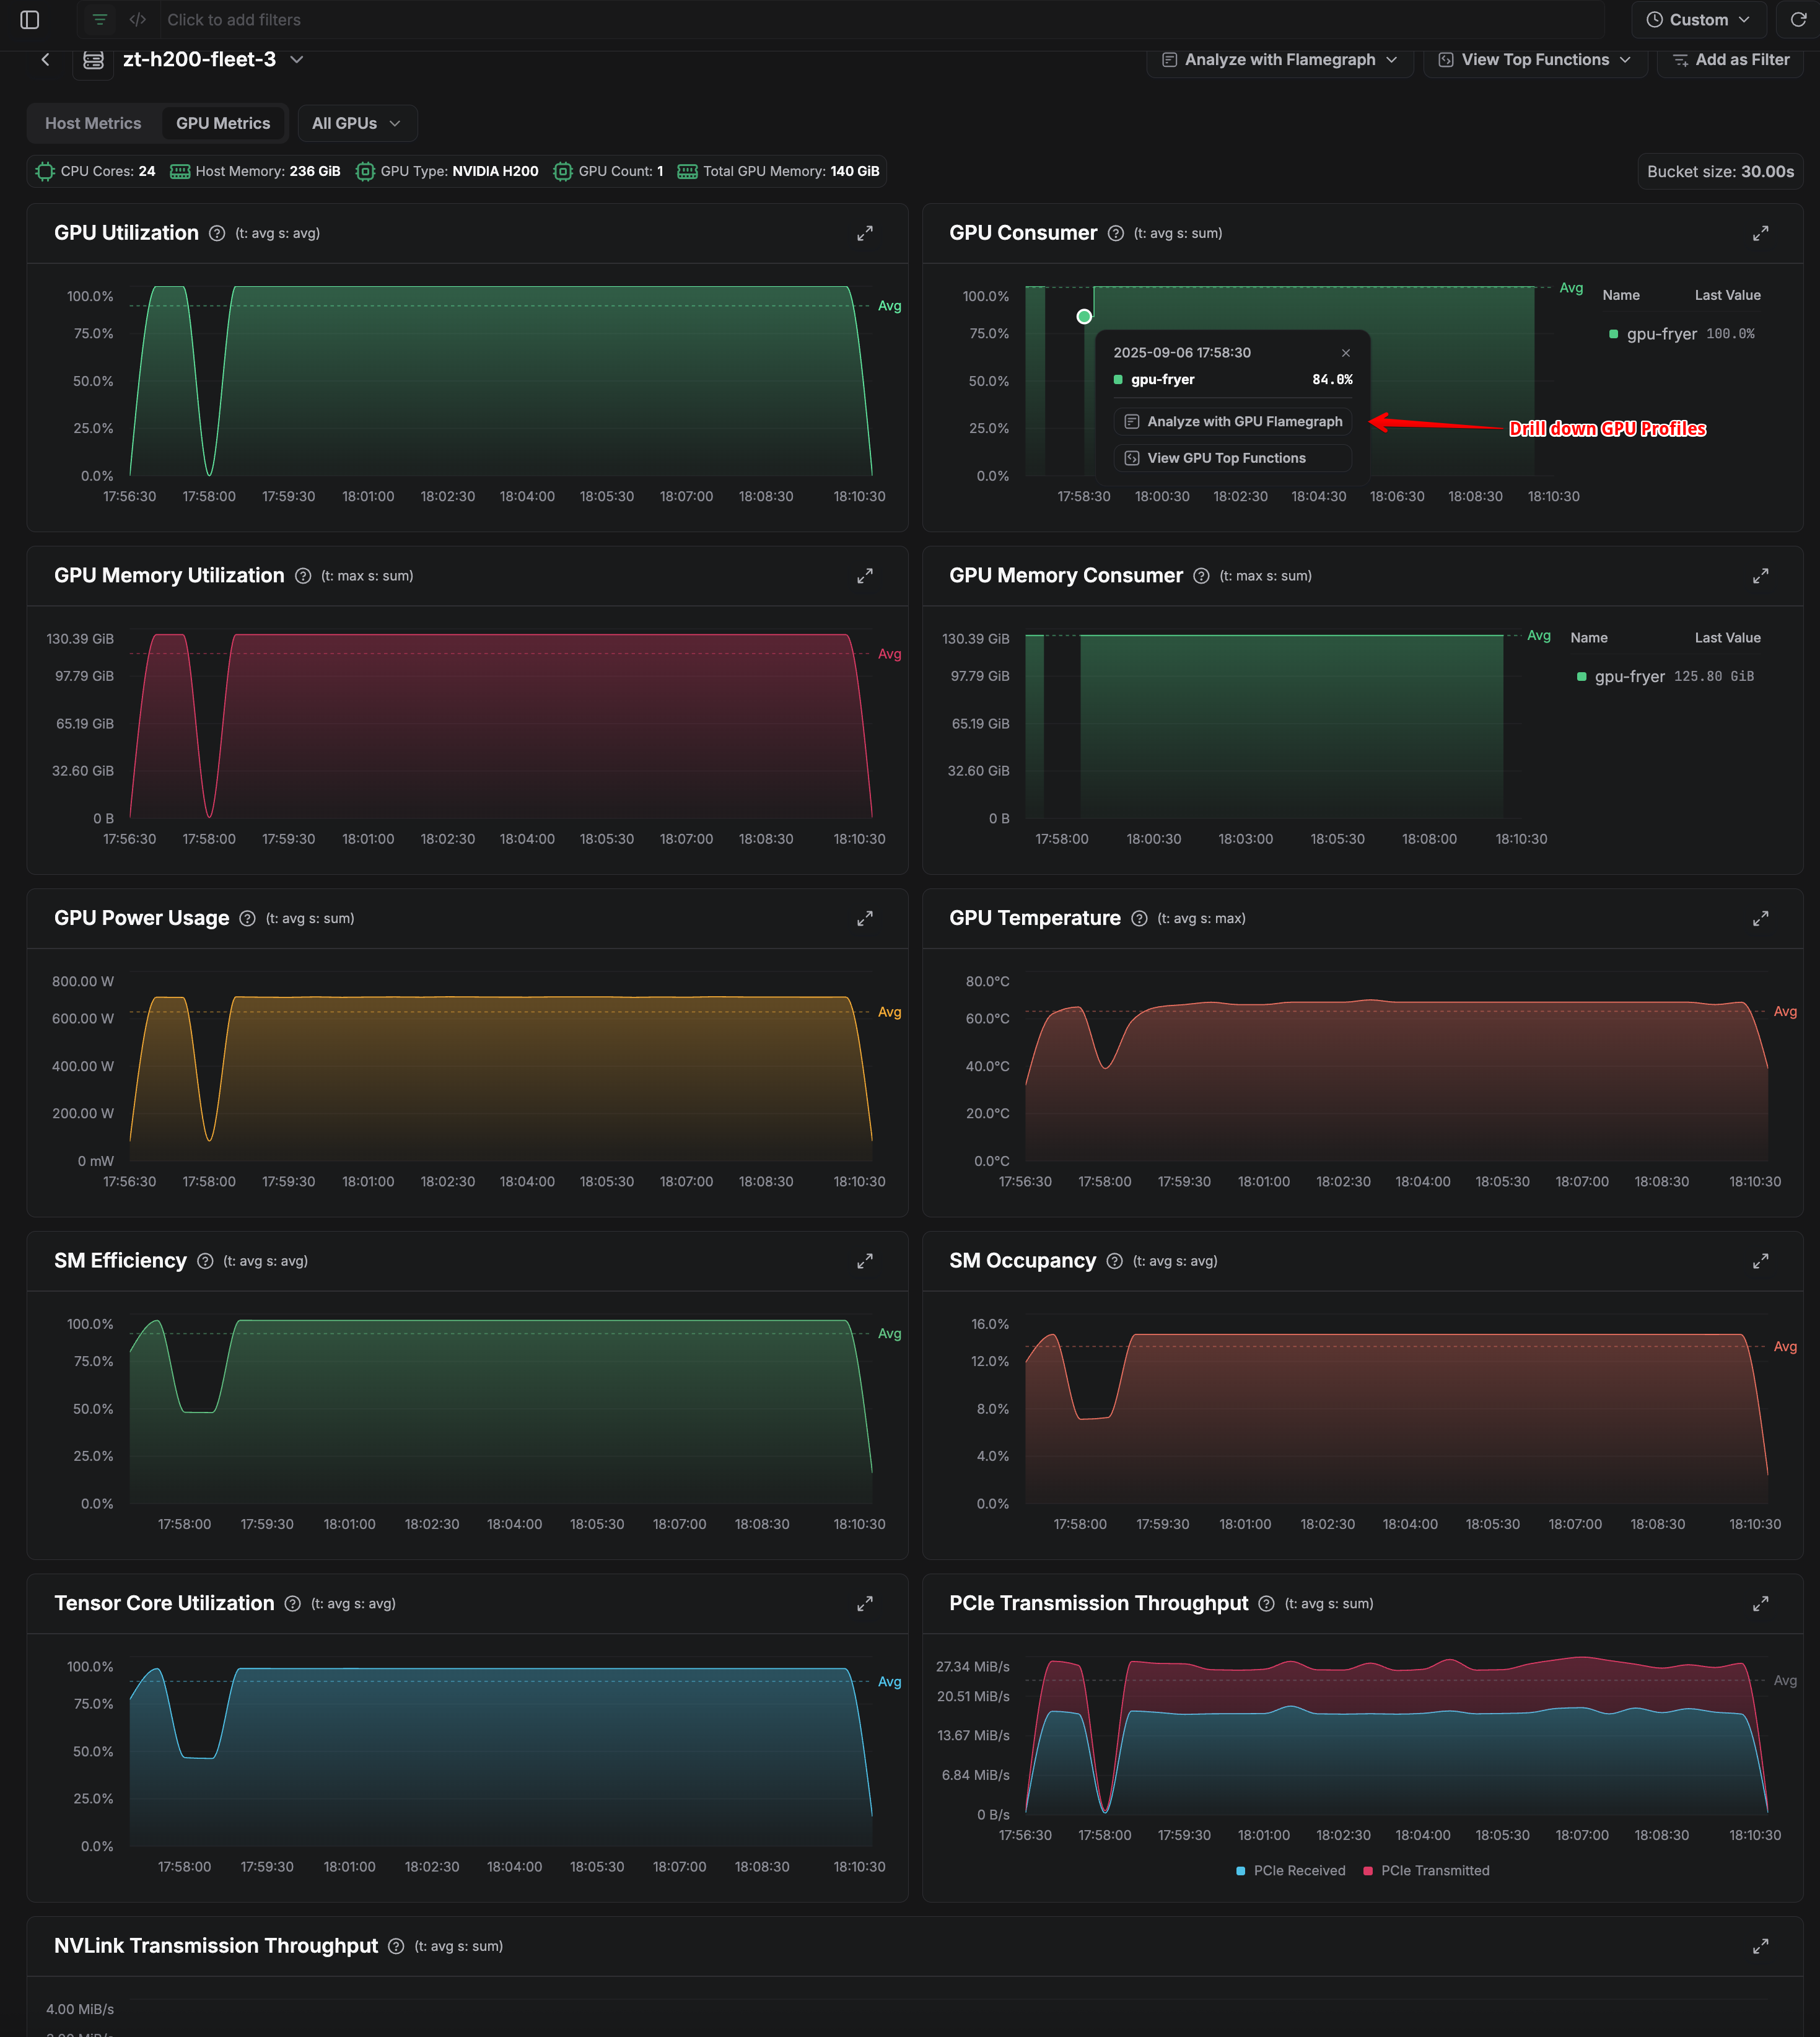
Zymtrace collects GPU metrics across four categories — Performance (GPU utilization and per-process consumers, SM efficiency/occupancy, Tensor Core utilization), Memory (VRAM utilization and per-process consumers), Hardware (power, temperature, clocks), and Data Transfer (PCIe, NVLink, and C2C throughput). SM Efficiency, SM Occupancy, and Tensor Core metrics are available only on data center GPUs (H100, H200, etc.).
For the complete list — every metric key, type, aggregation, and grouping dimension — see the Metrics Reference.
How GPU Metrics Collection Works
Zymtrace uses NVIDIA's NVML (NVIDIA Management Library) to collect GPU metrics. NVML provides a C API for monitoring and managing NVIDIA GPU devices, enabling us to gather real-time performance, utilization, and health data directly from the GPU hardware.
Using GPU Metrics with GPU Profiles
Once GPU metrics are enabled, you can navigate to Top Entities and select your GPU host to see the metrics dashboard. This view displays real-time and historical data across all categories, giving insight into patterns in utilization, memory usage, and power consumption. By examining these trends, you can identify anomalies that might indicate performance issues. Clicking on specific data points then allows you to drill down into detailed GPU profiles.
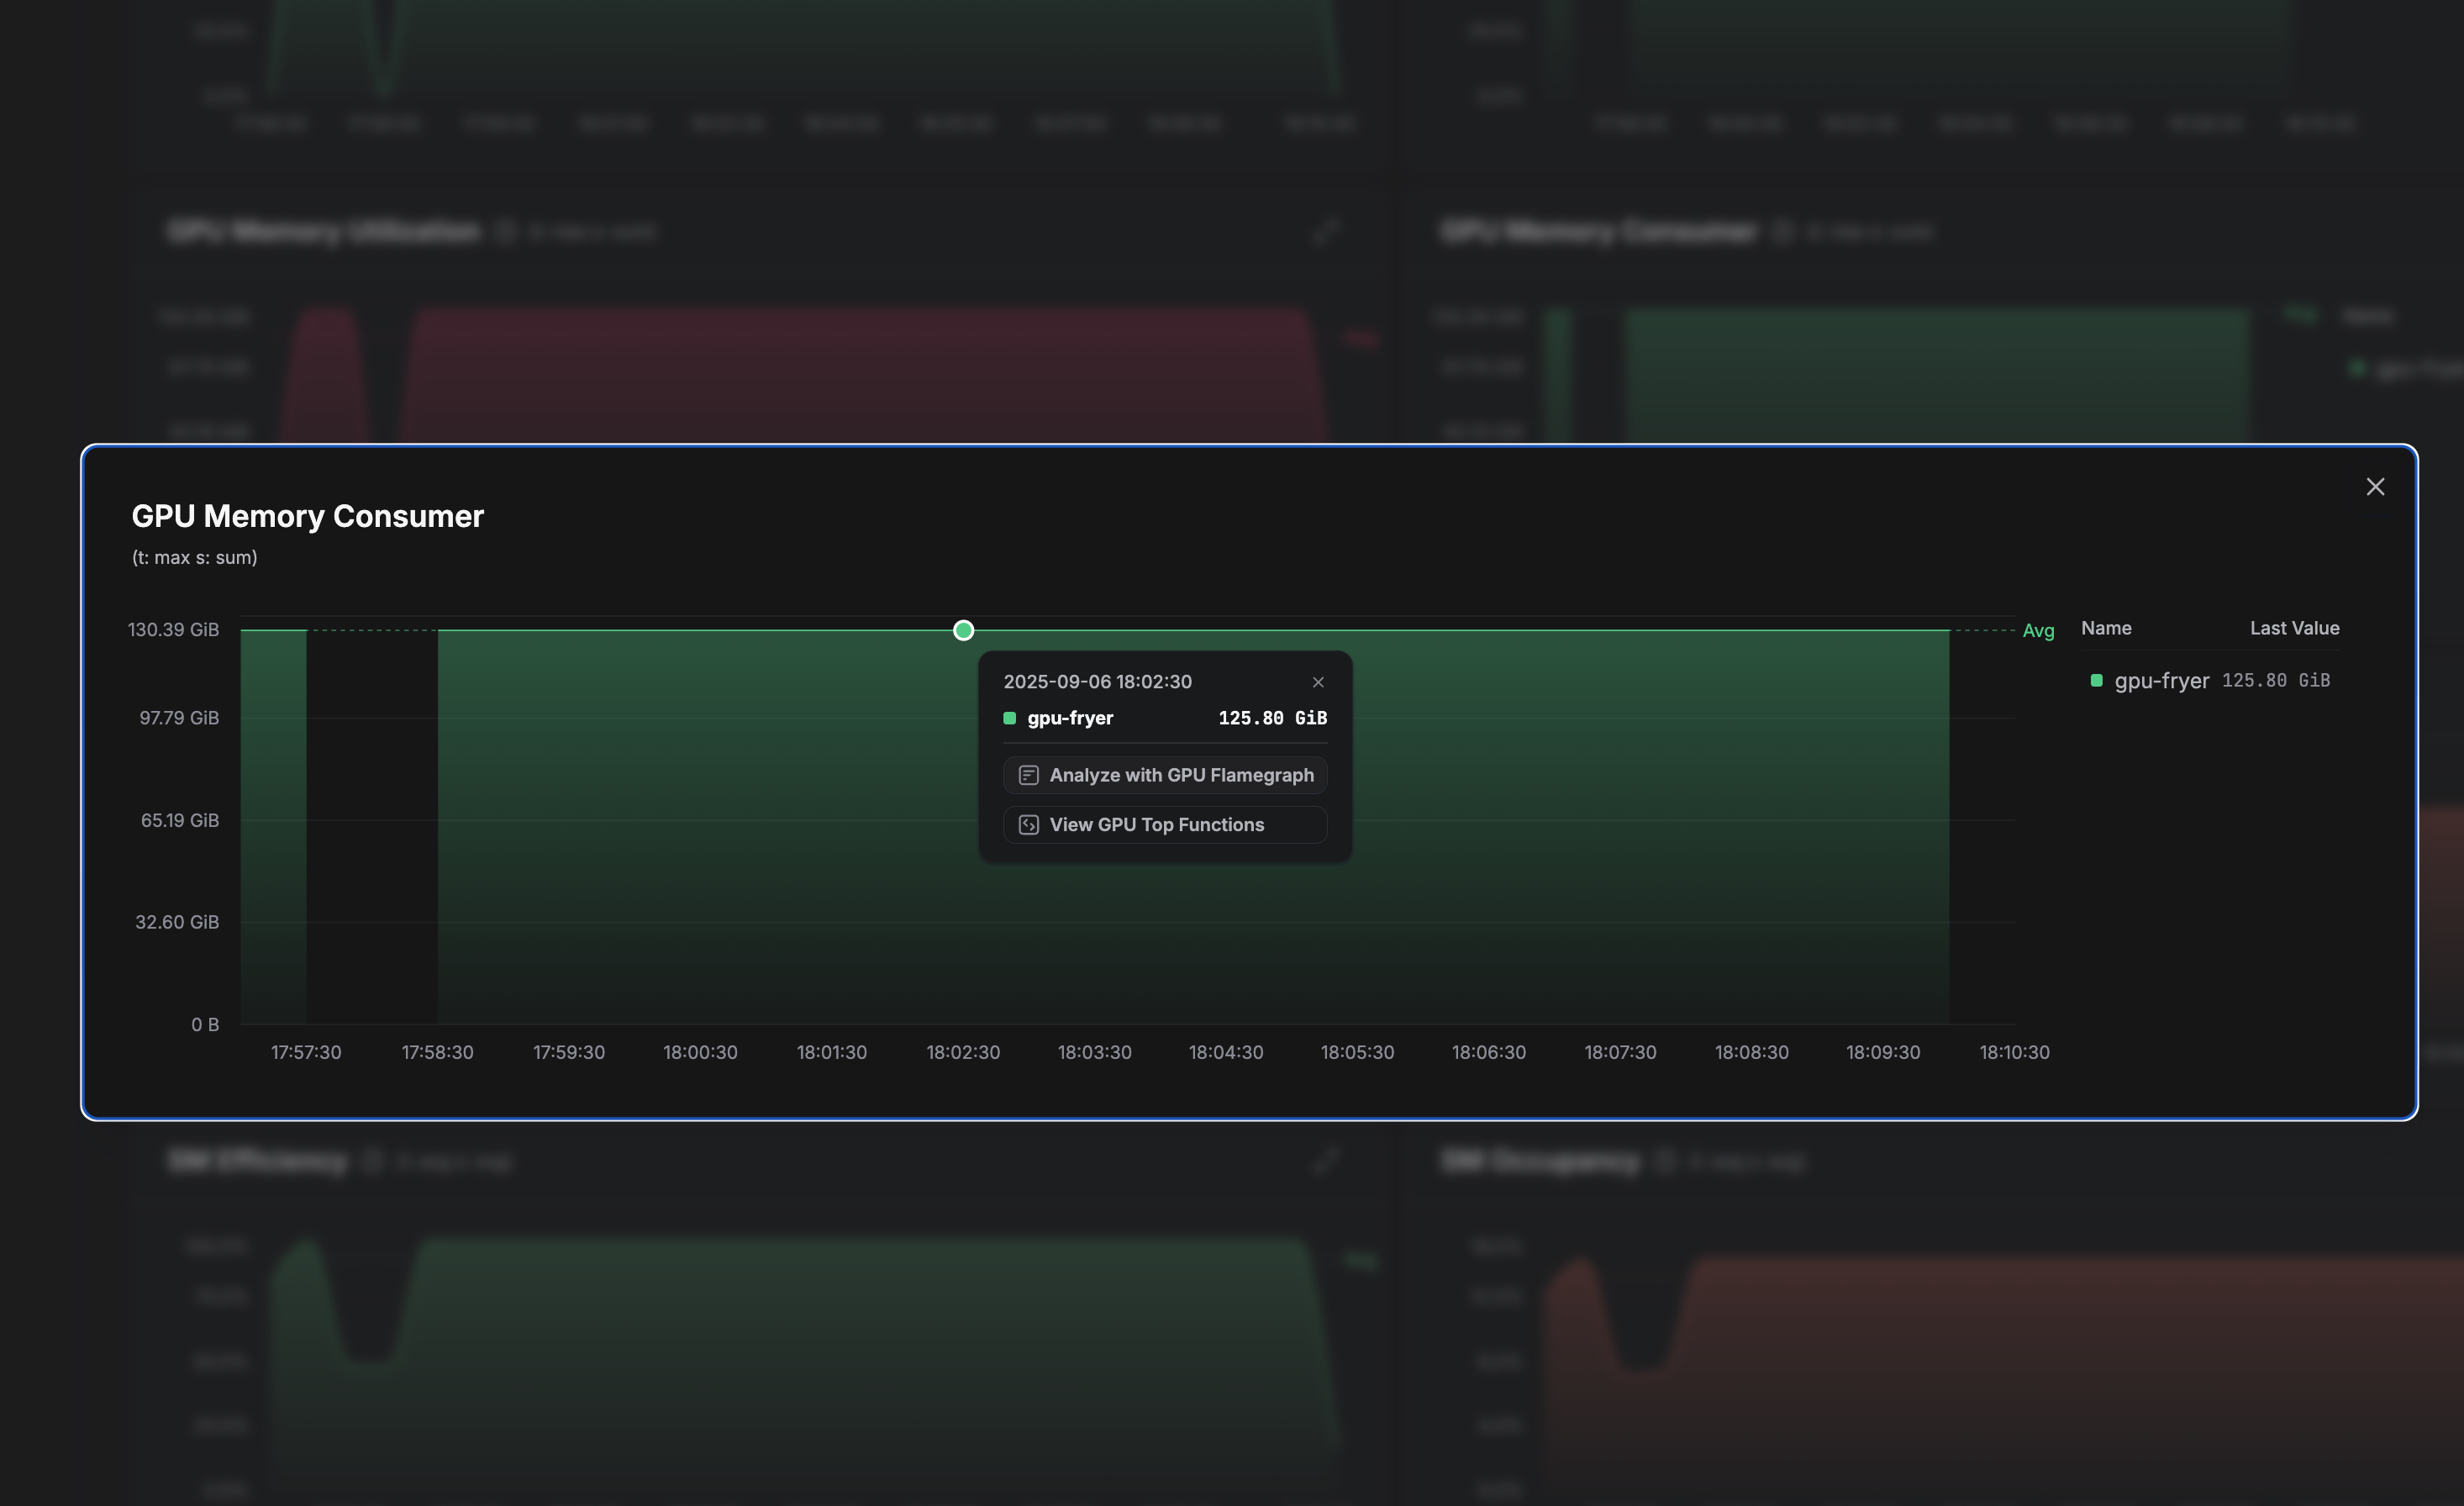
For more granular investigation, the metrics also provide process-level breakdowns. Expanding individual metric widgets shows which processes are consuming the most resources. For example, in our analysis, Hugging Face's GPU Fryer consumes roughly 90% of available GPU memory. This immediately suggests a hypothesis: high memory pressure could be contributing to performance degradation. Metrics like this guide the investigation toward examining memory allocation patterns and kernel execution characteristics for the process in question.
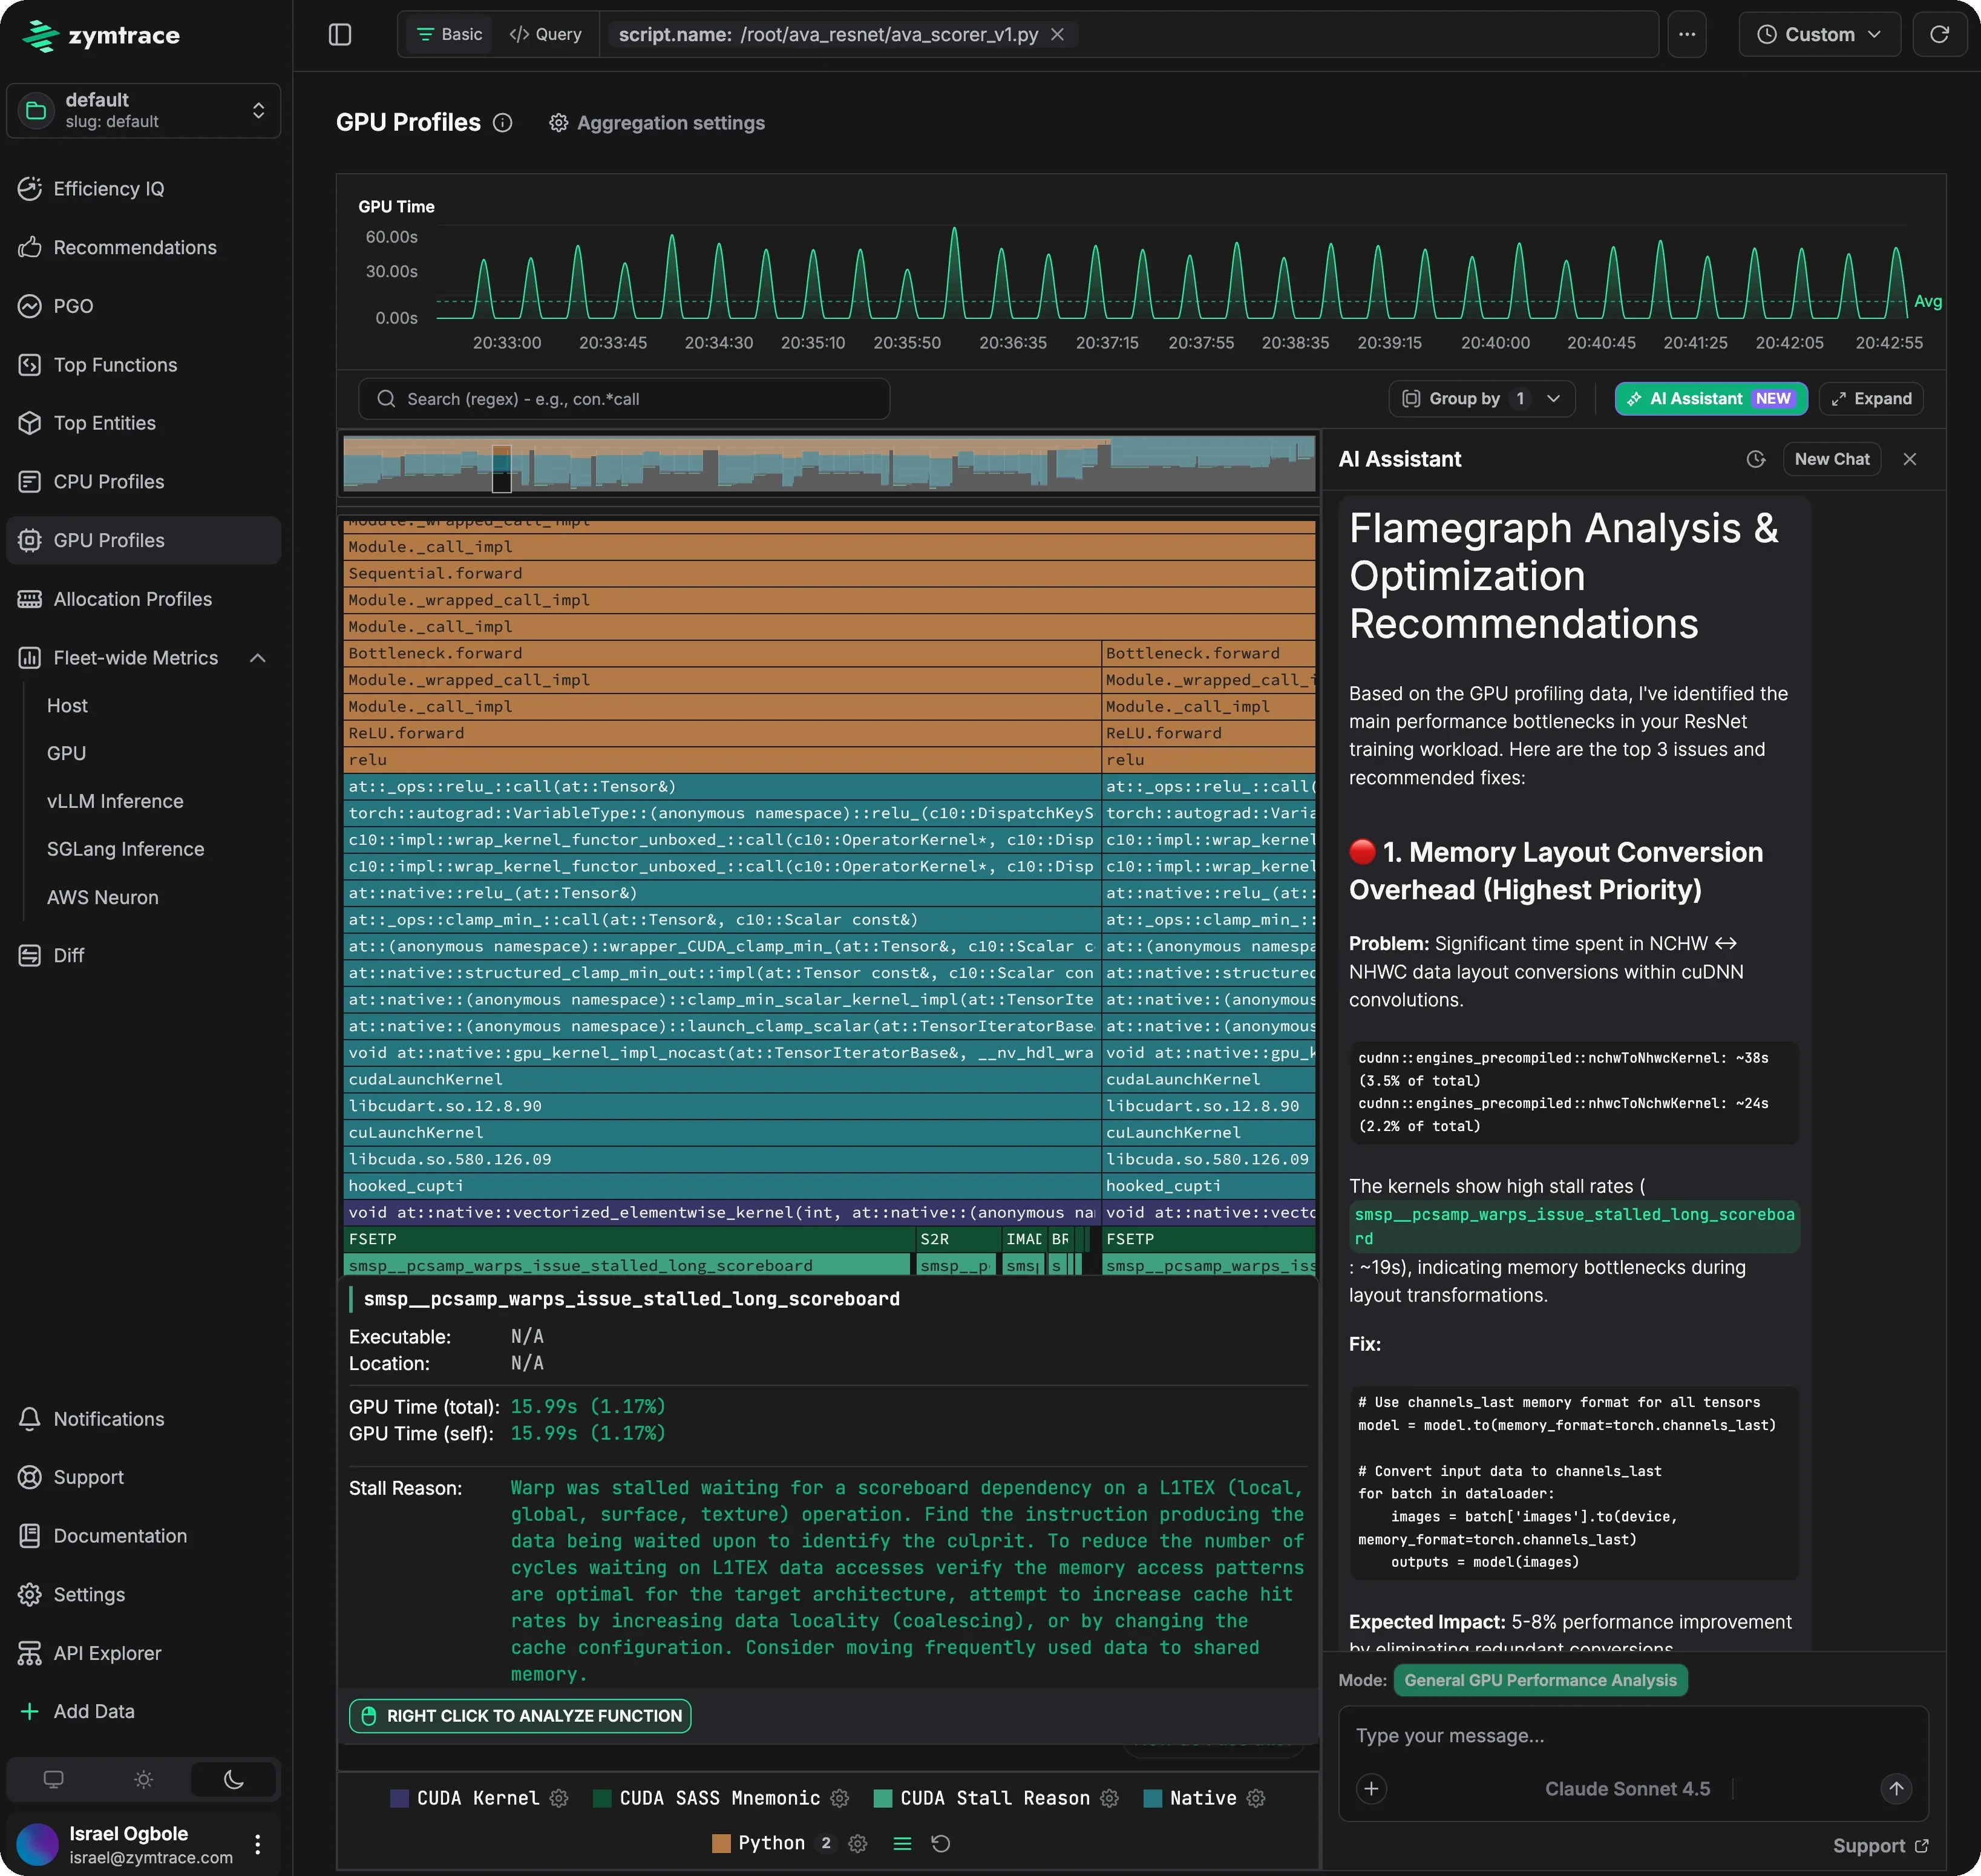
Clicking on the relevant data point, you can analyze the data with GPU profiles. The flamegraph above is scoped to a PyTorch ResNet inference script (script.name: /root/ava_resnet/ava_scorer_v1.py) and attributes GPU time through the full launch path: the Python module stack (Sequential.forward, Bottleneck.forward, ReLU.forward), the ATen operators behind it (at::_ops::relu_, clamp_min_), the CUDA runtime and driver (cudaLaunchKernel, cuLaunchKernel), and finally the CUDA kernel:
at::native::vectorized_elementwise_kernel
Below the kernel, the flamegraph continues to the instruction level: SASS mnemonics such as FSETP, S2R, and IMAD, and the PC-sampling stall reasons behind them. The selected stall reason here is smsp__pcsamp_warps_issue_stalled_long_scoreboard, accounting for 15.99s (1.17%) of GPU time. It means warps were stalled waiting on a scoreboard dependency for an L1TEX (local, global, surface, or texture) memory operation: the kernel is memory-bound on this path.
The built-in AI assistant analyzes the same flamegraph and turns the observation into an actionable recommendation. In this run it flags memory-layout conversion overhead (the nchwToNhwcKernel and nhwcToNchwKernel cuDNN kernels, roughly 5.7% of total GPU time combined) and suggests running the model in torch.channels_last memory format to eliminate the conversions, with an expected end-to-end improvement of 5 to 8%.
Understanding the Metrics
Performance Metrics
GPU Utilization provides the overall percentage of time your GPU is actively processing workloads. This is a key indicator of how well your GPU resources are being utilized.
GPU Consumer breaks down GPU utilization by process, helping you identify which applications or workloads are consuming the most GPU resources.
SM Efficiency measures how effectively the Streaming Multiprocessors are being utilized. It indicates the percentage of cycles where the SM has one or more of its assigned warps actively making progress in their execution. Low efficiency might indicate suboptimal kernel configurations or inefficient memory access patterns.
SM Occupancy shows the percentage of maximum possible threads that are active on the SMs. While higher occupancy often correlates with better performance, this isn't always the case.
Tensor Core Utilization is particularly important for AI/ML workloads, as it shows how well you're leveraging the specialized hardware designed for these operations.
Memory Metrics
GPU Memory Utilization shows how much of your GPU's VRAM is currently in use. Monitoring this metric helps prevent out-of-memory errors and optimize memory allocation strategies.
GPU Memory Consumer provides a breakdown of memory usage by process, helping identify which applications consume the most memory.
Hardware Metrics
GPU Power Usage and GPU Temperature are crucial for understanding the thermal and power characteristics of your workloads. These metrics help with capacity planning and thermal management strategies.
Data Transfer Metrics
PCIe Transmission Throughput measures data movement between the GPU and system memory, which can become a bottleneck for data-intensive workloads.
NVLink Transmission Throughput (available on supported hardware) measures high-speed GPU-to-GPU communication, which is critical for multi-GPU workloads.