SLURM-Aware GPU Profiling
SLURM is how most distributed GPU clusters run training and inference: many jobs from many users, packed onto shared nodes, with a single job often spanning dozens of nodes and hundreds of GPUs. Zymtrace tags every GPU kernel, CPU sample, and metric with the SLURM job that produced it, including its ID, name, and owner, so a distributed job that fans out across the whole cluster still shows up as one job. This works the same for NVIDIA and AMD nodes. You can slice flamegraphs and metrics by job or user across every node it touches, with no changes to your job scripts.
What is SLURM?
SLURM (Simple Linux Utility for Resource Management) is the most widely used open-source workload manager for HPC and AI clusters. It maintains a queue of jobs and schedules them onto compute nodes, allocating CPUs, memory, and GPUs to each job and enforcing resource limits through Linux cgroups.
Users submit work as batch jobs with sbatch or interactively with srun, and SLURM
queues, places, and runs each job across the cluster. On GPU clusters, SLURM is the
standard way training and inference jobs land on shared nodes, frequently one job per GPU
or per MIG slice on NVIDIA hardware. Because many jobs from many
users share the same hardware, being able to attribute profiles and metrics back to a
specific job and user is essential for understanding who is consuming what.
How it works
Every profile and metric collected on a SLURM node is enriched with three attributes:
| Attribute | Description |
|---|---|
slurm.job.id | SLURM job ID |
slurm.job.name | SLURM job name |
slurm.job.user | Name of the user who submitted the job |
When SLURM is configured with cgroup-based process tracking, it places every job's processes inside a dedicated cgroup hierarchy, one cgroup per job, per step, per task. On a cgroup v2 host that hierarchy looks like:
/system.slice/<node>_slurmstepd.scope/job_<jobid>/step_<stepid>/user/task_<n>
Zymtrace profiler already reads the cgroup of every process it samples, so it
reads this SLURM job context directly from the kernel. There is no sidecar, no
instrumentation, and no change to your job scripts. The job_<jobid> component yields
slurm.job.id, and Zymtrace resolves the job's name and owning user from the same job
metadata SLURM records for the cgroup.
Because attribution is derived from the cgroup, a SLURM tag rides along with every other
dimension. A GPU job appears with its slurm.job.* attributes as well as its gpu.name,
host.name, container.name, and (on NVIDIA) MIG instance, so
you can go from "which of Bob's jobs is hottest on the GPU" straight into the exact CUDA
or HIP kernel.
Attribution applies uniformly across:
- GPU flamegraphs: CUDA and HIP kernels, memory operations, and synchronization correlated with the launching CPU stacks
- GPU and host metrics: utilization, memory, power, and the other NVIDIA and AMD device metrics
- CPU profiles: native, Python, Go, Java, Node, Ruby, and more
SLURM detection is fully automatic. Once the profiler is running and SLURM uses cgroup/v2 tracking (below), SLURM jobs show up with no additional flags.
Requirements
SLURM attribution depends on the per-job cgroup, so the enabling requirement is on the SLURM side:
- SLURM configured with cgroup/v2 process tracking:
proctrack/cgroupplustask/cgroup, andCgroupPlugin=cgroup/v2incgroup.conf. This is the piece Zymtrace requires. Without cgroup tracking (for exampleproctrack/linuxprocortask/none), SLURM does not create a per-job cgroup and jobs cannot be attributed. - A cgroup v2 unified host with systemd: SLURM creates each job's cgroup as a systemd
scope over dbus. Confirm with
stat -fc %T /sys/fs/cgroup(expectcgroup2fs). - The Zymtrace profiler running on the compute nodes. See the profiler installation guide.
- GPU profiling enabled for the workload (for the GPU side). On NVIDIA nodes, enable GPU profiling; on AMD nodes, start the workload with the ROCm profiling environment variables. CPU profiling is on by default.
Enabling cgroup tracking in SLURM
Add the cgroup plugins to slurm.conf:
# slurm.conf
ProctrackType=proctrack/cgroup
TaskPlugin=task/cgroup,task/affinity
JobAcctGatherType=jobacct_gather/cgroup
And enable the cgroup/v2 plugin in cgroup.conf:
# cgroup.conf
CgroupPlugin=cgroup/v2

ConstrainCores=yes
ConstrainRAMSpace=yes
ConstrainSwapSpace=no
ConstrainDevices=yes
CgroupPlugin=cgroup/v2 is the setting Zymtrace needs. The Constrain* options are the
standard resource-isolation controls and are recommended but not required for attribution.
Restart the control and compute daemons to apply the change (changing ProctrackType
requires no running jobs):
systemctl restart slurmctld
systemctl restart slurmd
New jobs submitted after the restart are placed in per-job cgroups and appear in Zymtrace within seconds.
Slicing GPU profiles and metrics by SLURM job
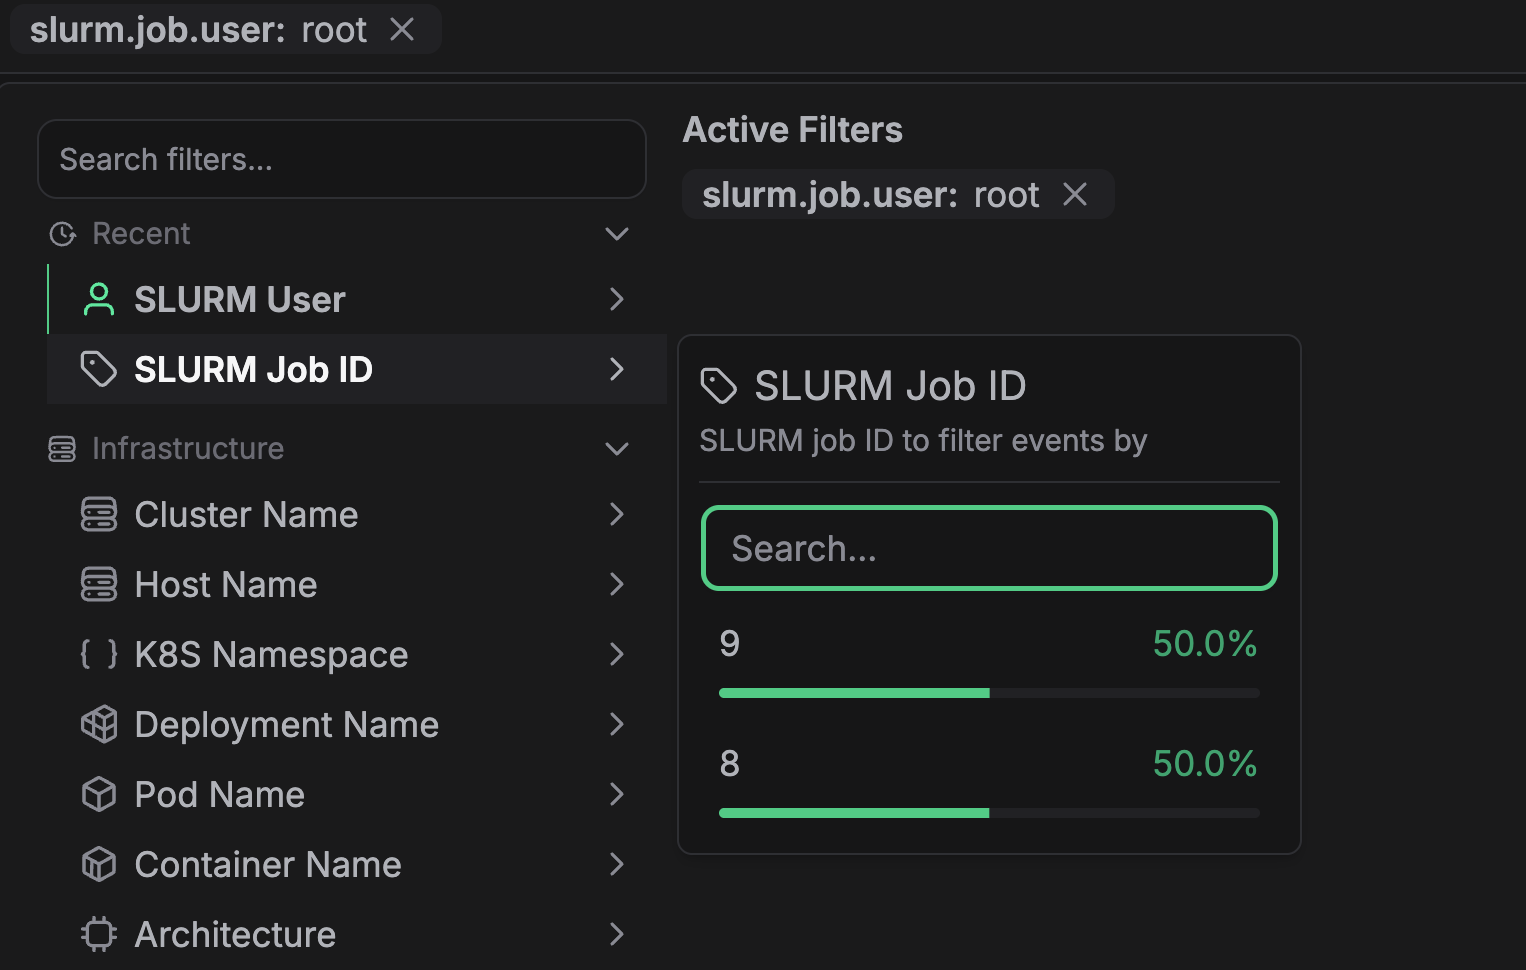
SLURM attributes behave like any other Zymtrace dimension. Use them in the global filter bar in either mode (see Filtering Data):
- Click and apply: pick a
slurm.job.id,slurm.job.name, orslurm.job.uservalue from the filter list. - Query mode: write a CEL expression.
slurm.job.id == "1234"
// one user's specific job
slurm.job.user == "bob" && slurm.job.id == "1234"
// wildcard match on job name
matches(slurm.job.name, "train.*")
Combine SLURM attributes with any other GPU dimension, for example one user's job on a particular MIG slice or device model:
slurm.job.user == "carol" && matches(gpu.name, ".*MIG 3g.40gb")
slurm.job.user == "carol" && gpu.name == "AMD Instinct MI300X"
Filters apply globally and persist as you navigate, so a SLURM filter scopes Efficiency IQ, Top Functions, Top Entities, and both CPU and GPU profiles at once. Because the filter follows the job rather than any single machine, a multi-node distributed job is aggregated into one view no matter how many nodes and GPUs it spans. This lets you answer questions like "which of a user's jobs is burning the most GPU time across the cluster?" or "show me the combined flamegraph for job 1234" without changing anything about how the jobs run.
Related
- Filtering Data: full filter attribute reference and CEL syntax
- MIG-Aware GPU Profiling: per-instance GPU attribution on NVIDIA, common in SLURM GPU clusters
- NVIDIA GPU Metrics & Profiles and AMD GPU Metrics & Profiles: enabling and using GPU metrics
- Install the Profiler: deploy the profiler on your compute nodes