Model shapes
The Models page lists every PyTorch model the profiler has observed inside a running process and shows its structure as it exists at runtime, which includes the module tree, the tensor shapes and dtypes of each module, and the tensor- and pipeline-parallel layout. The same information lets the CUDA flamegraph attribute each GPU kernel to the model layer that launched it.
Without it, two decoder layers of a transformer look the same in a profile, because they run the same forward, launch the same kernels, and share the same Python stack. With it, layers.17 and layers.18 are separate frames, and the share of GPU time in attention versus MLP, or in one layer versus another, can be read from the flamegraph directly.
NVTX ranges provide similar layer context, but the framework or the model code has to emit them, and the ranges add significant overhead to the workload. Model shapes come from the process itself, so nothing has to be annotated, and nothing runs on the forward path.
Models are in Beta. Extraction is off by default in the GPU profiler, and the Models page is hidden behind a feature flag. See Enabling model shapes below.
Enabling model shapes
Two switches are involved, one in the GPU profiler of the workload and one in the Zymtrace UI.
Profiler
Set ZYMTRACE_CUDAPROFILER__MODEL_SHAPE__ENABLED=true in the environment of the profiled process, next to CUDA_INJECTION64_PATH (see Manual Injection via Environment Variables). On AMD hosts, set ZYMTRACE_ROCMPROFILER__MODEL_SHAPE__ENABLED=true instead. The other settings have defaults that fit most workloads. See Configuration.
The GPU profiler config rule under Settings → Agent Config does not expose the model shape settings yet. Processes profiled through automatic injection need the environment variable on the workload.
UI
- Open Settings → Feature Flags.
- Turn on Models.
The Models entry appears in the sidebar for every user of the instance. The flag only controls the page. Model layer frames in the flamegraph do not depend on it.
Opening the Models page

The page lists the models seen in the selected time range and matching the current filter. Each row shows:
| Column | Meaning |
|---|---|
| Model | The name the model is served under, with its architecture class beneath. A model without a serving framework shows its Hugging Face name_or_path, else the architecture, else the root module class. A model with none of these shows unnamed. |
| Parameters | Logical parameter count of the whole model. Tied weights count once, buffers do not count, and quantized weights count their logical elements rather than their packed words. |
| Modules | Number of modules in the tree. |
| Hosts, Machines, Processes | How many of each ran this model in the range. |
| Parallelism | TP n and PP n when the model is sharded, and — otherwise. |
| First seen, Last seen | When the profiler first and last reported the model. Hover for the exact timestamp. |
The filter bar accepts the same query syntax as the other pages, restricted to the fields a model can be scoped by, which are host.name, process.executable.name, script.name, job.tag, container.name, k8s.pod.name, k8s.deployment.name, k8s.namespace.name, slurm.job.id, slurm.job.name, slurm.job.user, user.tag, and cluster.name. Any other field reports Unsupported filter field.
A tensor- or pipeline-parallel deployment is one row that covers the whole model, not one row per rank or stage.
If the page shows No models seen in this time range, either no profiled process loaded a PyTorch model in the range, or extraction is not enabled for that process. If a row opens to Shape not stored yet, the model was reported but its module tree has not been ingested. Retry shortly.
Reading the module graph
Click a row to open the model. The header repeats the model's parameters, weight bytes, modules, hosts, machines, and processes, together with its parallel layout.
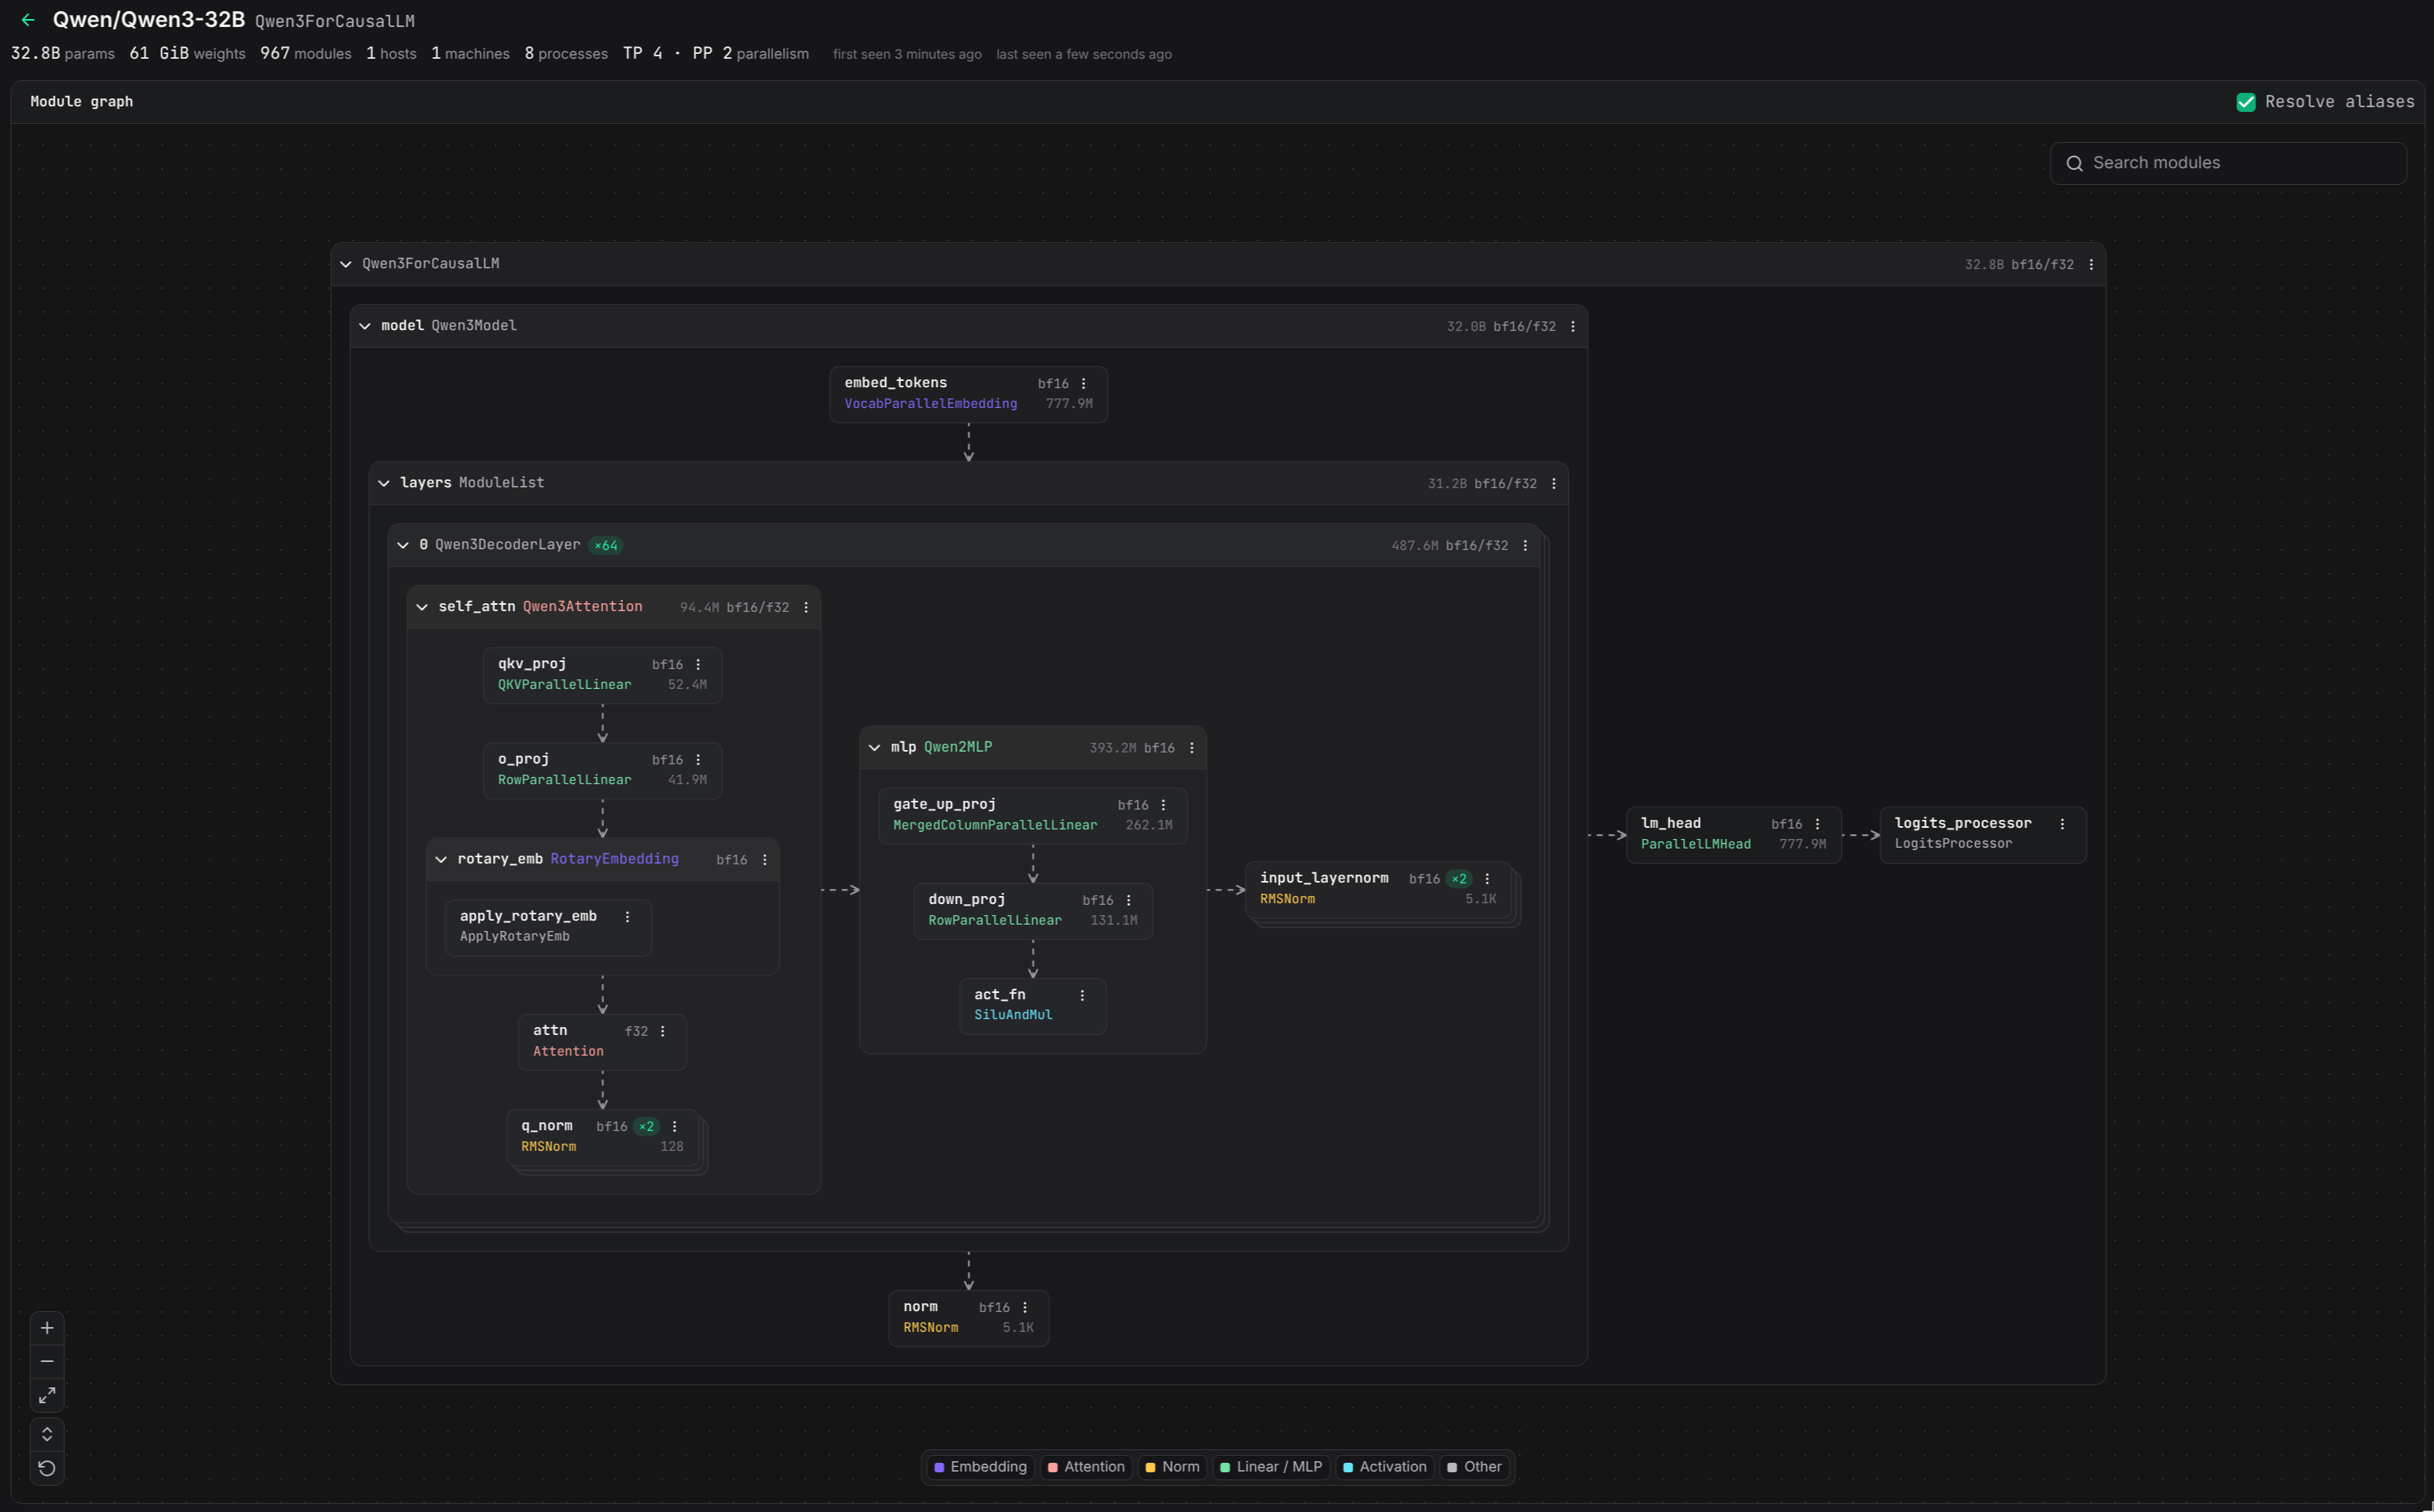
The graph is the module tree as PyTorch registered it. Sections nest the way the modules do, and each node carries the module's name, class, parameter count, and the dtypes of its weights. The top-level sections are expanded on load, and sections with a single child are opened through to the first branching point.
- Folded siblings: Consecutive siblings with the same structure are folded into one node with a repeat count. The 64 decoder layers of Qwen3-32B read as one
Qwen3DecoderLayermarked ×64. The details pane names the first and last index the node stands for. - Roles: Module classes are tinted by role, where the roles are Embedding, Attention, Norm, Linear / MLP, Activation, and Other. Hover a role in the legend to spotlight its modules. A collapsed section that hides modules of that role shows how many. Click a role to keep the spotlight on, and press
Escapeto release it. - Search: The search box finds modules by name, class, or path, through collapsed sections. Picking a hit expands the path to it and selects it.
- Aliases: A module that is registered under more than one path, such as an output head tied to the input embedding, appears at every path. With Resolve aliases on (the default), the alias nodes link to the module whose tensors they share, and selecting either end draws the connection. Turn it off to treat every path as its own module.
- Controls: The pills on the canvas zoom in and out, fit the graph to the view, expand every section, and reset the view to its initial state.
Module details
Click a module to open its details beside the canvas. Click the canvas to close them.
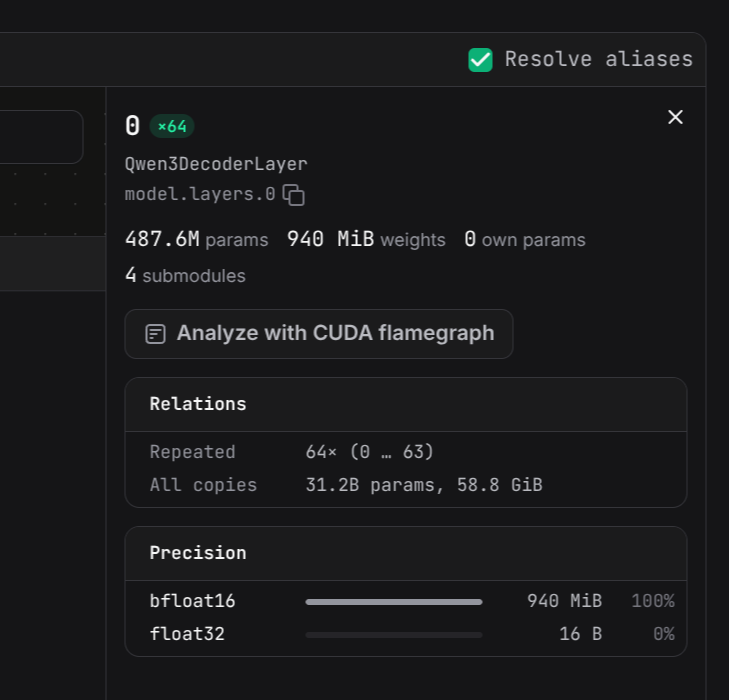
- Totals: The parameter count and weight bytes of the module including everything below it, the number of parameters the module holds itself, and the number of submodules it contains.
- Relations: For a folded node, the repeat count and the parameter and weight totals across all copies. For an alias, the path of the module it shares. Click it to reveal that module in the graph.
- Precision: Weight bytes per dtype, as a share of the module's weights. Dtypes without a known size are listed as unsized.
- Tensors: Every parameter and buffer the module holds directly, with name, shape, dtype, and size. A container such as a decoder layer holds none and shows no table. Buffers are marked
buffer. A tensor that shares its storage with another module is markedshares <path>.
The Analyze with CUDA flamegraph button opens the flamegraph searched for this module's frames (see Model layer frames). The same action is in each node's menu on the canvas.
Tensor- and pipeline-parallel models
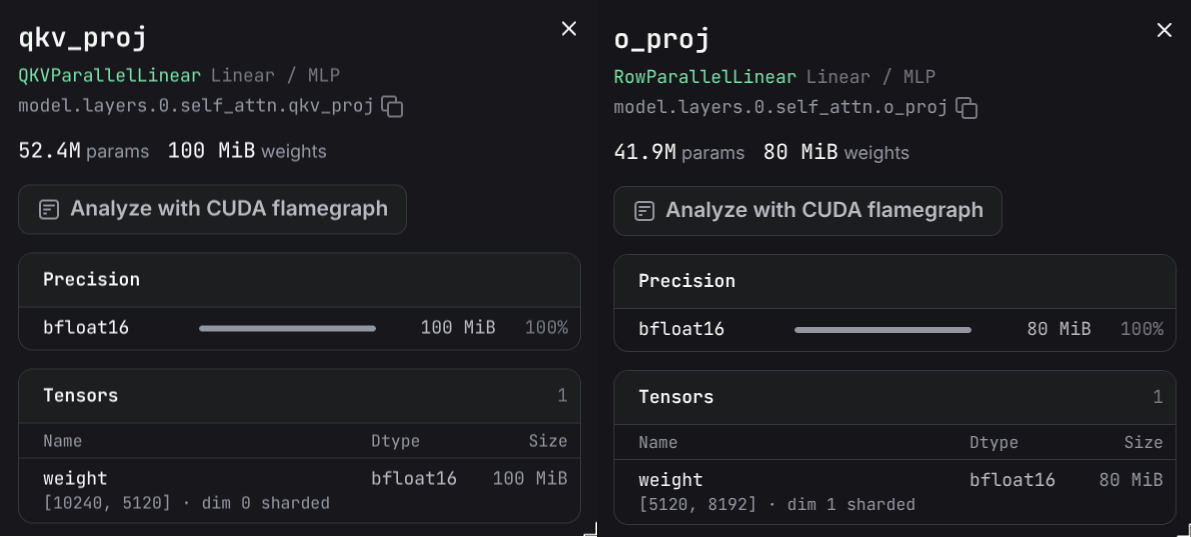
For a tensor-parallel deployment, the graph shows the logical model, not one rank's slice of it. Every tensor lists its full shape, and a sharded tensor names the dimension it is split along. The fused qkv_proj of a Qwen3Attention module shows its complete output dimension of 10240 with dim 0 sharded, and the o_proj after it shows its full input dimension of 8192 with dim 1 sharded. Each rank holds a quarter of those dimensions under TP 4.
For a pipeline-parallel deployment, the graph and the parameter count cover the whole model, not the stage one process holds.
Quantized weights stored in packed integers show their packed bit width, for example 4-bit packed on a qweight tensor. Their parameter count uses the logical element count.
The parallel layout is read from vLLM's parallel configuration. A process without it reports a single rank with the shapes it holds.
Model layer frames
When model shape extraction is on, the CUDA flamegraph of the process gains Model Layer frames. Every kernel launched from inside a module gets a layer frame at the depth where that module's forward runs, named after the module. A decoder layer sits above the layer's work, its attention module sits inside it, and the projection sits directly above the GEMM. The model's root frame carries the model name, so Qwen/Qwen3-32B sits at the top of its stacks.
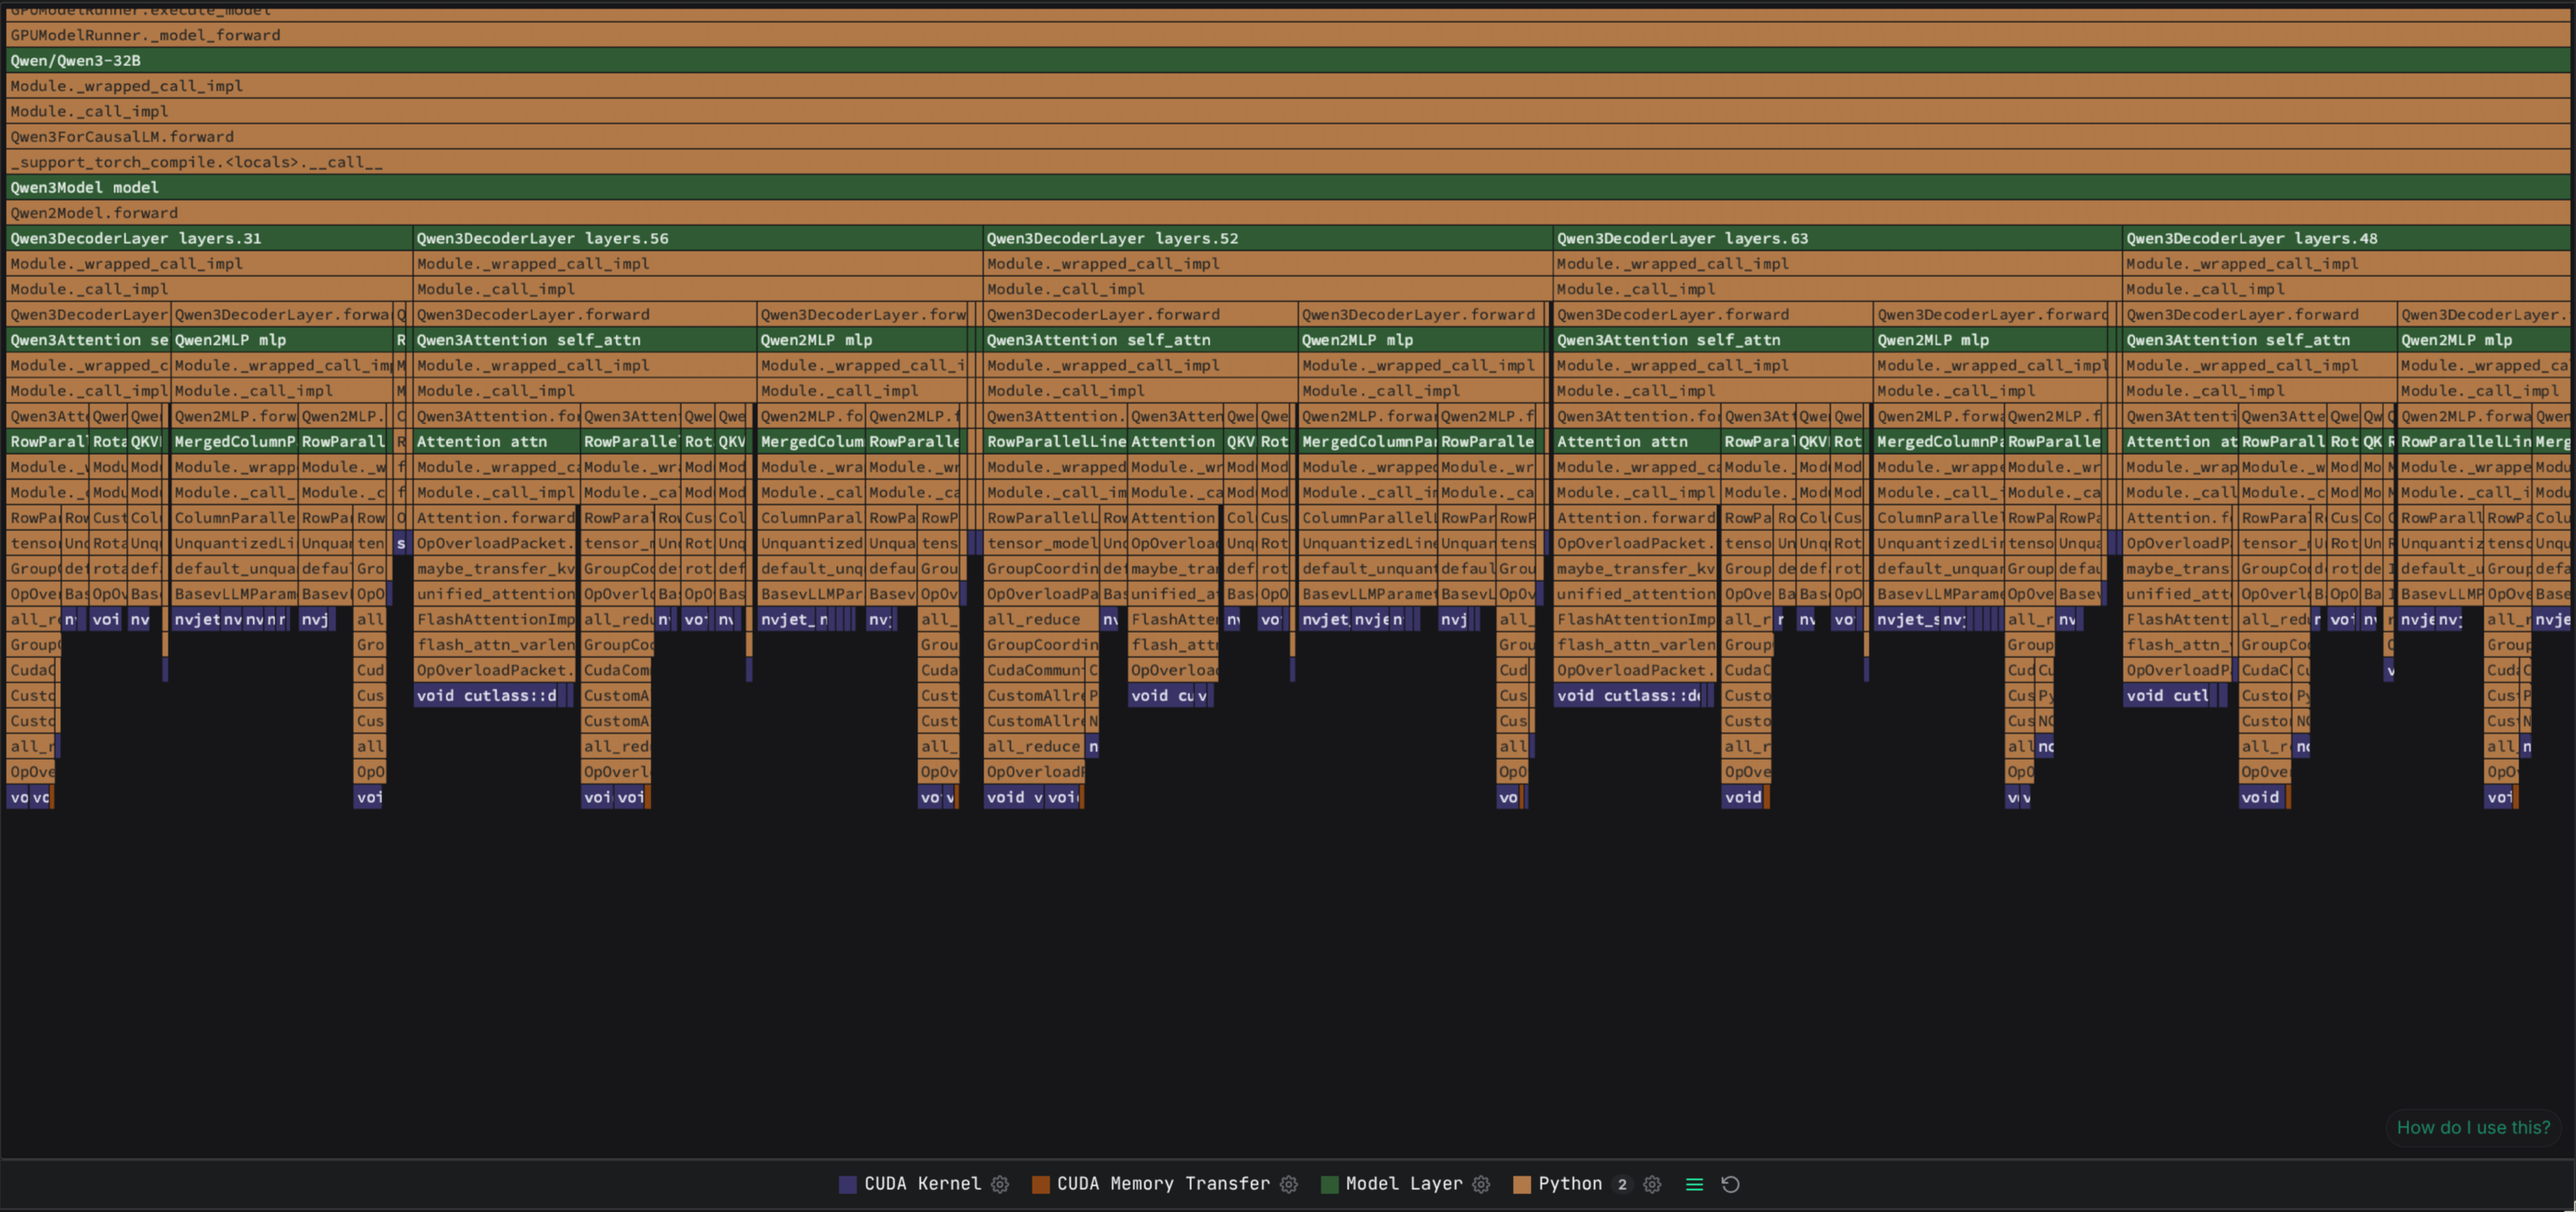
Model Layer frames have their own color and their own entry in the flamegraph legend. Click Model Layer in the legend to hide them. The flamegraph then looks as if the feature is disabled, where the samples of all layers and modules merge back into the shared Python stack with no separation between them. Click the entry again to bring the frames back.
From a frame to the model
Selecting any frame that runs inside a model shows the model graph in the frame details, opened on the enclosing module, which is marked parent. From a kernel, that is the projection or attention module that launched it. From a layer frame, it is the layer itself.
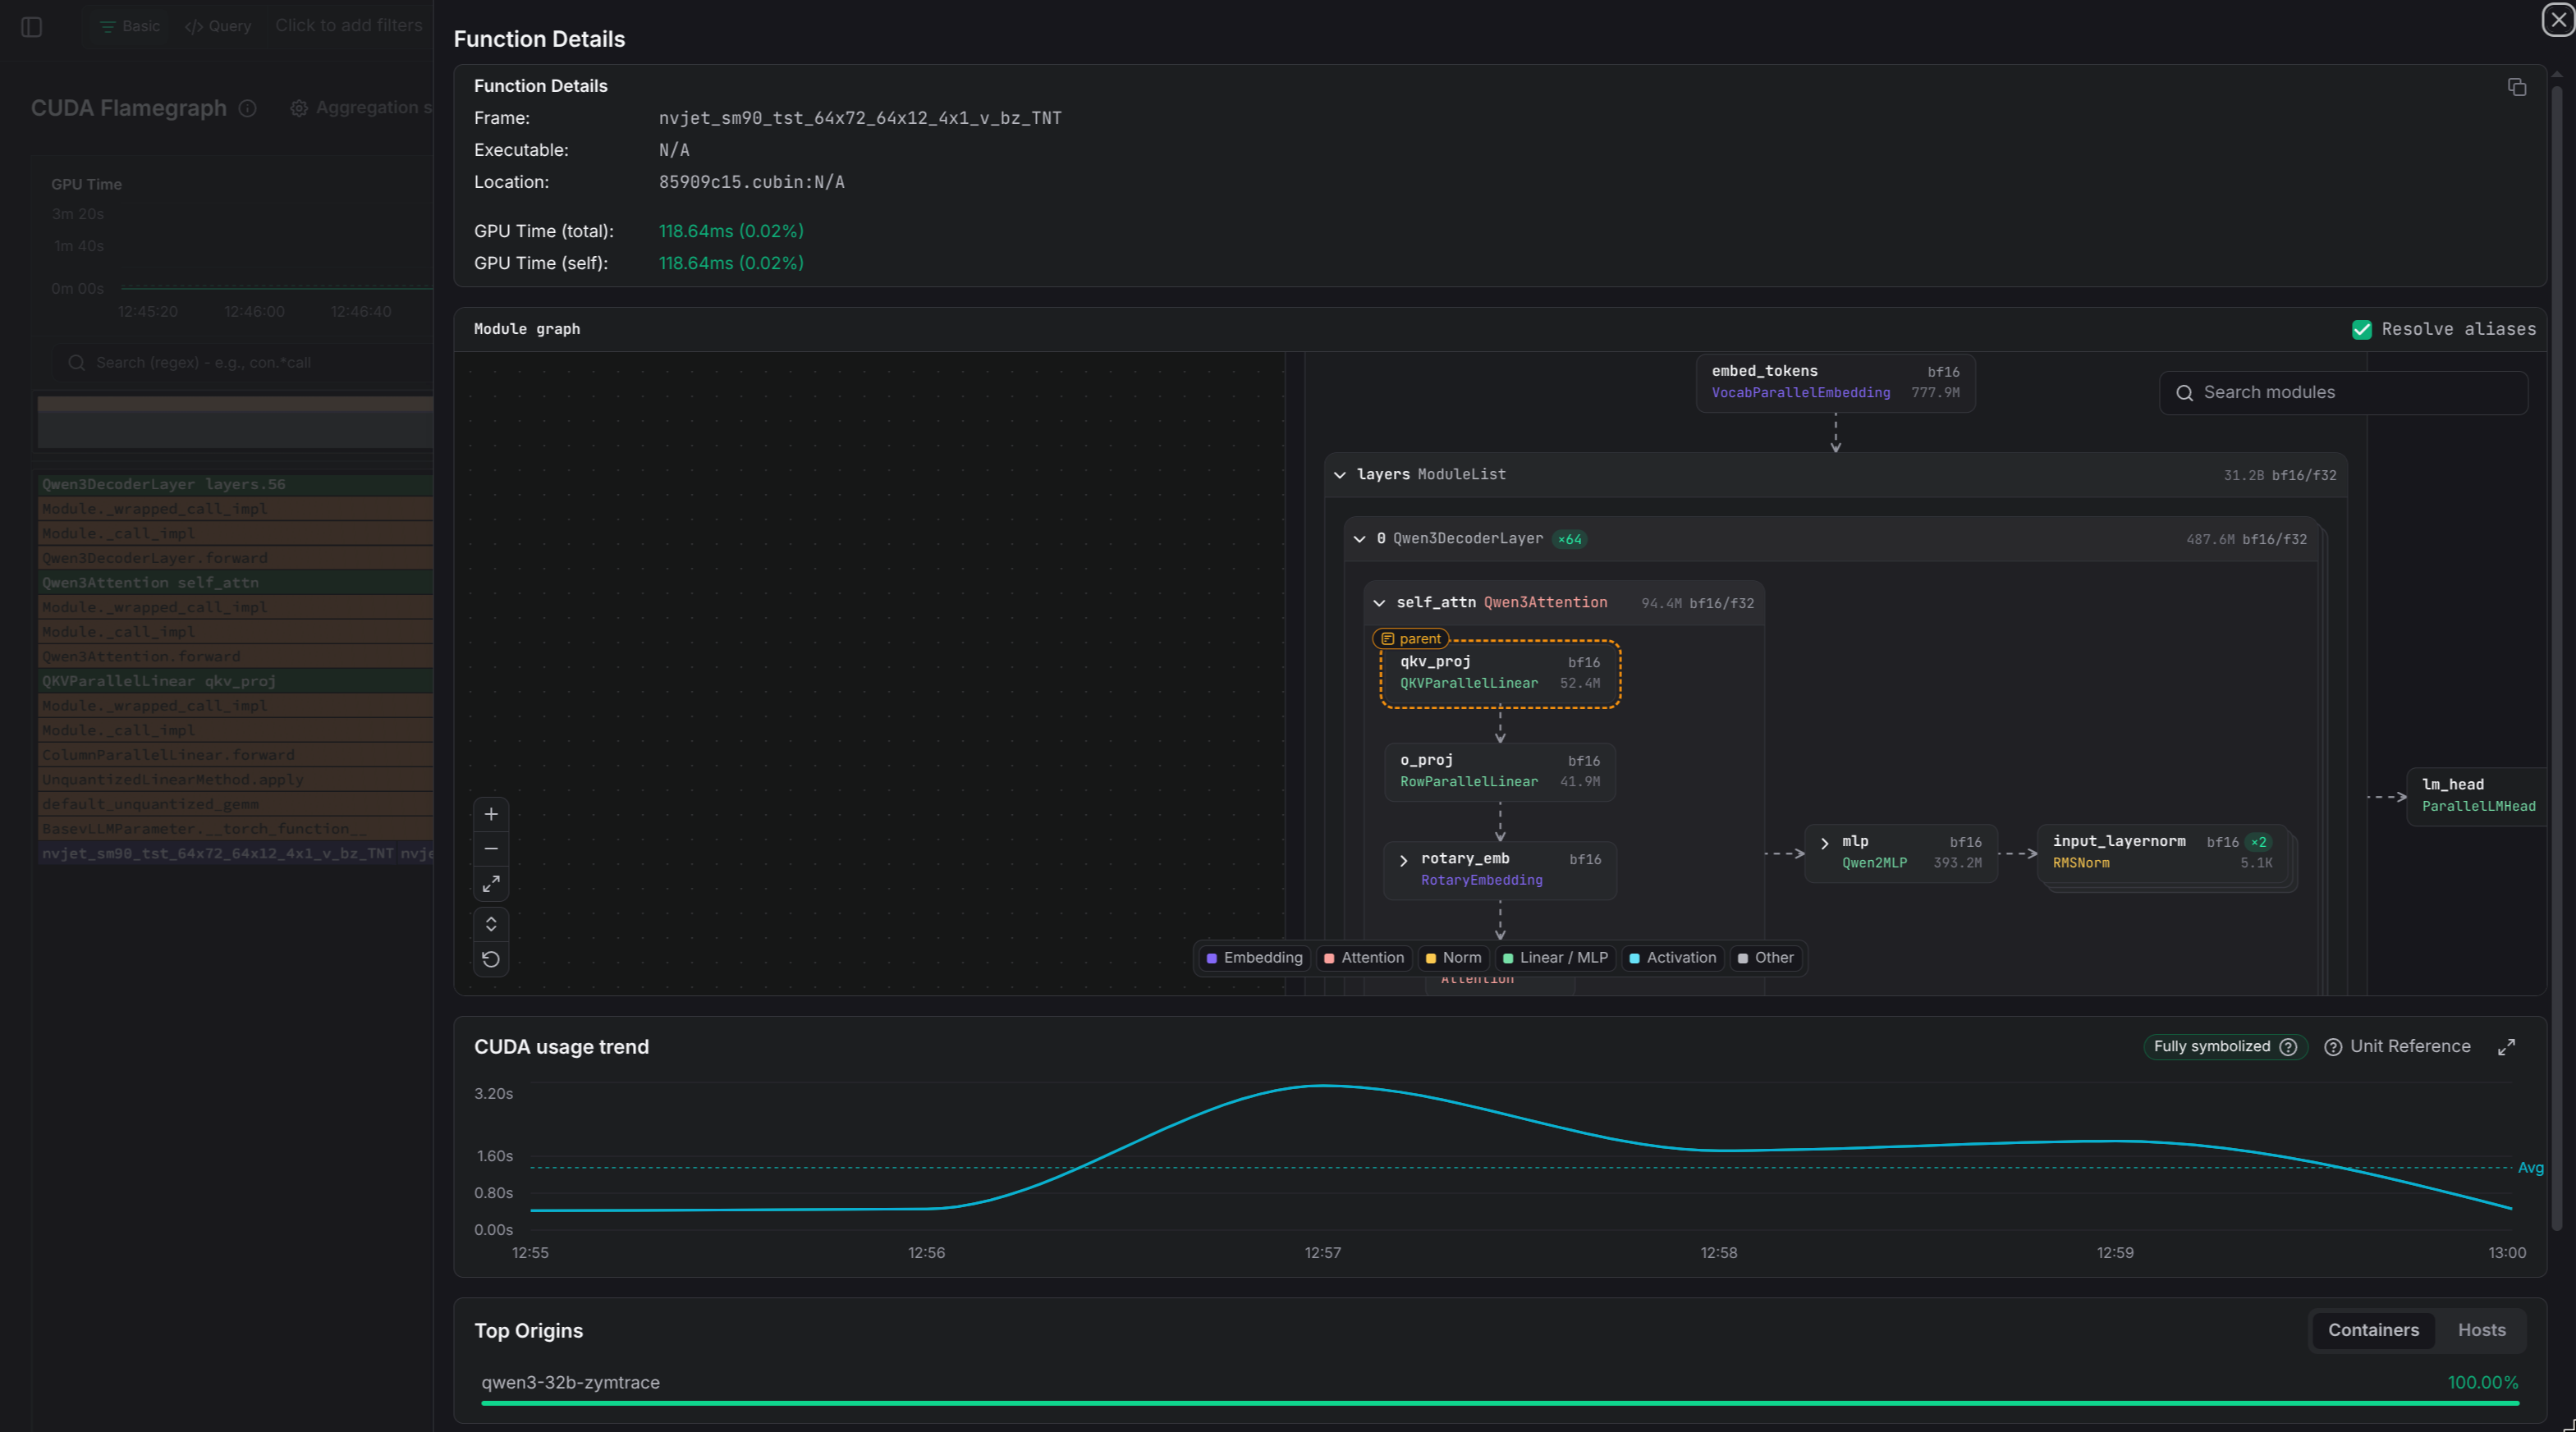
From a module to the flamegraph
Analyze with CUDA flamegraph on a module opens the CUDA flamegraph with the search set to that module's frame name. For a folded node, the search matches the module in every copy, so Qwen3Attention self_attn lights up attention in all 64 layers. The root node searches for the model name.
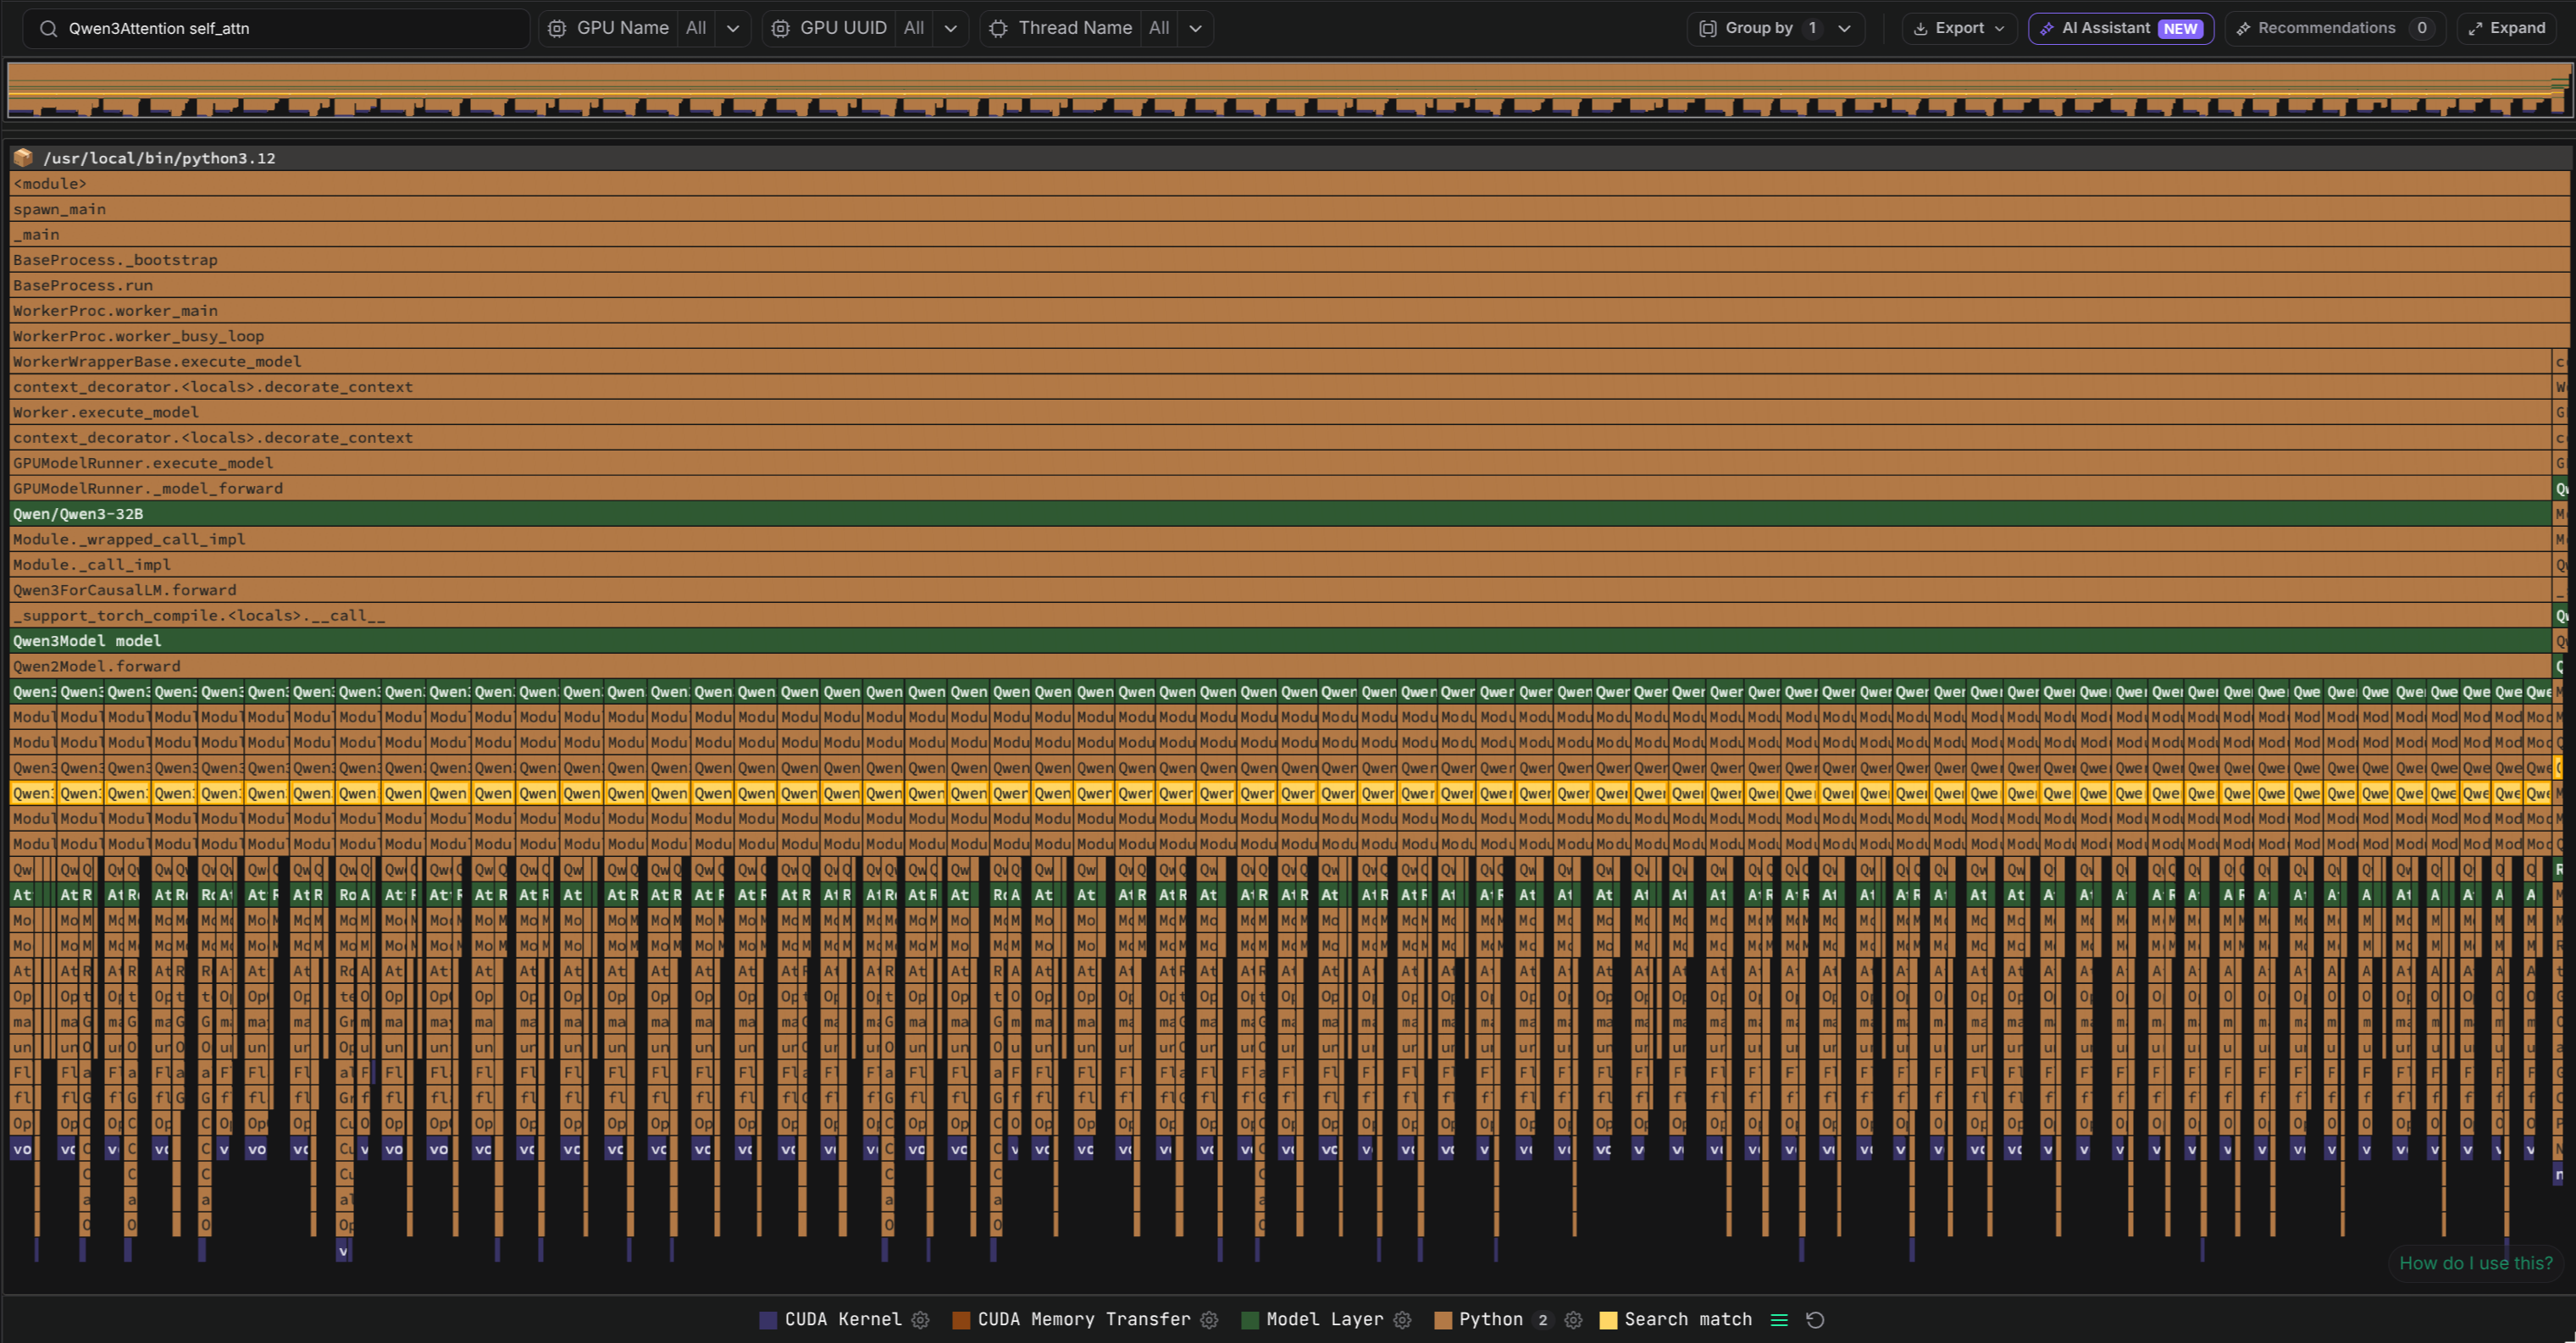
If the search matches nothing, the flamegraph reports This module has no frames in the current flamegraph and offers the way back to the model. See Limitations for why a module can run without frames.
Configuration
The GPU profiler reads these variables from the environment of the profiled process. The ROCm profiler reads the same variables with the prefix ZYMTRACE_ROCMPROFILER__MODEL_SHAPE__.
| Variable | Default | Purpose |
|---|---|---|
ZYMTRACE_CUDAPROFILER__MODEL_SHAPE__ENABLED | false | Turns model shape extraction on or off. |
ZYMTRACE_CUDAPROFILER__MODEL_SHAPE__POLL_INTERVAL | 30 | The time in seconds between two checks for a changed model. |
ZYMTRACE_CUDAPROFILER__MODEL_SHAPE__SETTLE | 2 | The time in seconds that the profiler waits after the last module registration before it reads the model. |
ENABLED
Set this variable to true to turn on model shape extraction for the process. The profiler then reads the structure of each PyTorch model in the process and sends it to the backend. The Models page shows the model, and the CUDA flamegraph of the process shows Model Layer frames. When the variable is false, the profiler does not read models, and the flamegraph shows no Model Layer frames.
POLL_INTERVAL
This variable sets the time in seconds between two checks for a changed model. Each check walks the module tree of the process and takes the Python interpreter for that time. The profiler sends a new snapshot only when the structure of a model has changed. A larger value reduces the overhead of the checks. A smaller value shows a changed model in the UI sooner, but adds overhead to the workload. Keep the default unless a model in the process changes its structure at run time.
SETTLE
This variable sets the time in seconds that the profiler waits after the last module registration before it reads the model. A framework builds a model from many modules, one after the other. The wait makes sure that the profiler reports the complete model one time, and not a partial model many times. If a model loads slowly and the Models page shows more than one version of it, increase this value. The minimum is 0.1 seconds. If a process does not stop module registrations, the profiler reads the model after the poll interval at the latest.
How it works
Zymtrace reads the model structure from the running process, the same way the GPU profiler is already injected. No code change, annotation, or extra dependency is needed in the workload, and any PyTorch model is covered, whether it is served by vLLM or run by a training script.
The structure is read once a model is loaded, and a short check runs every poll interval on one thread to detect a change. Nothing runs on the forward path, and a snapshot is sent only when the structure changed.
Layer attribution happens in the profiler agent, outside the process, from the stacks it already collects for GPU samples. Each module is tracked as its own object, so two layers of the same class get separate frames. Restarts and replicas of the same model share one entry on the Models page, and a change in structure, such as a different quantization, produces a new one.
We benchmarked a vLLM server with the GPU profiler attached, with and without model shape extraction, in eager mode, with CUDA graphs, and with torch.compile, at multiple concurrency levels. With the default poll interval, the throughput and the latency are within the run-to-run noise in every mode. The feature adds a fixed amount of roughly 25 MB to the memory of the worker process, independent of the load.
Limitations
- CUDA graph replay: A replayed graph launches its kernels from a different stack than the one that captured them, so the module frames have no matching place in it. The agent inserts them directly above each kernel instead. The module names remain, but the nesting of the live stack does not. Run with
--enforce-eagerfor attribution at full depth. - Fused kernels: A kernel produced by
torch.compileor a fused attention implementation can combine work from several modules. It is attributed to the module whoseforwardlaunched it, which can be a parent of the modules whose math it contains. - CPU flamegraphs: Module identity is recorded for GPU samples only. The CPU flamegraph of the same process shows the Python stacks without layer frames.
- Backward passes: Kernels of the backward pass get no layer frames yet. Attribution of backward work to its module is planned.
- Parallel layout: TP and PP sizes and ranks are read from vLLM's parallel configuration. Other launchers report one rank with the shapes that rank holds.