GPU Straggler Detector
See Introducing Zymtrace GPU Straggler Detector for two use cases, from detection to the fix: the sequence-length straggler from ByteDance's OSDI '25 study, and a throttled GPU, simulated the way the FALCON study does.
In distributed training and other multi-GPU jobs, a single slow GPU can hold back every other GPU. GPUs exchange data through collective operations such as AllReduce, and a collective can't finish until every GPU in its group, or communicator, has joined it. When one GPU falls behind, the others wait for it, and the slowest GPU sets the pace for the whole job.
A GPU that holds the others back like this is a straggler. Common causes include a throttled GPU, a faulty NVLink connection, an overloaded host, and GPU or workload imbalance. Metrics and profiles usually show that something is wrong, but in a cluster of thousands of GPUs, it's hard to trace those symptoms back to the GPU responsible and the reason it fell behind.
Zymtrace finds that GPU for you. Our proprietary detection algorithm analyzes metrics from the NVIDIA Collective Communications Library (NCCL), which runs these collectives, and pinpoints the GPU that holds back the rest of its communicator, along with the host it runs on. Zymtrace lists what it finds on the Stragglers & Collectives page:
- Stragglers: GPUs that reach collectives late and make the rest of their communicator wait.
- Slow operations: collectives whose bandwidth drops well below their recent normal.
For each one, Zymtrace points to likely causes.
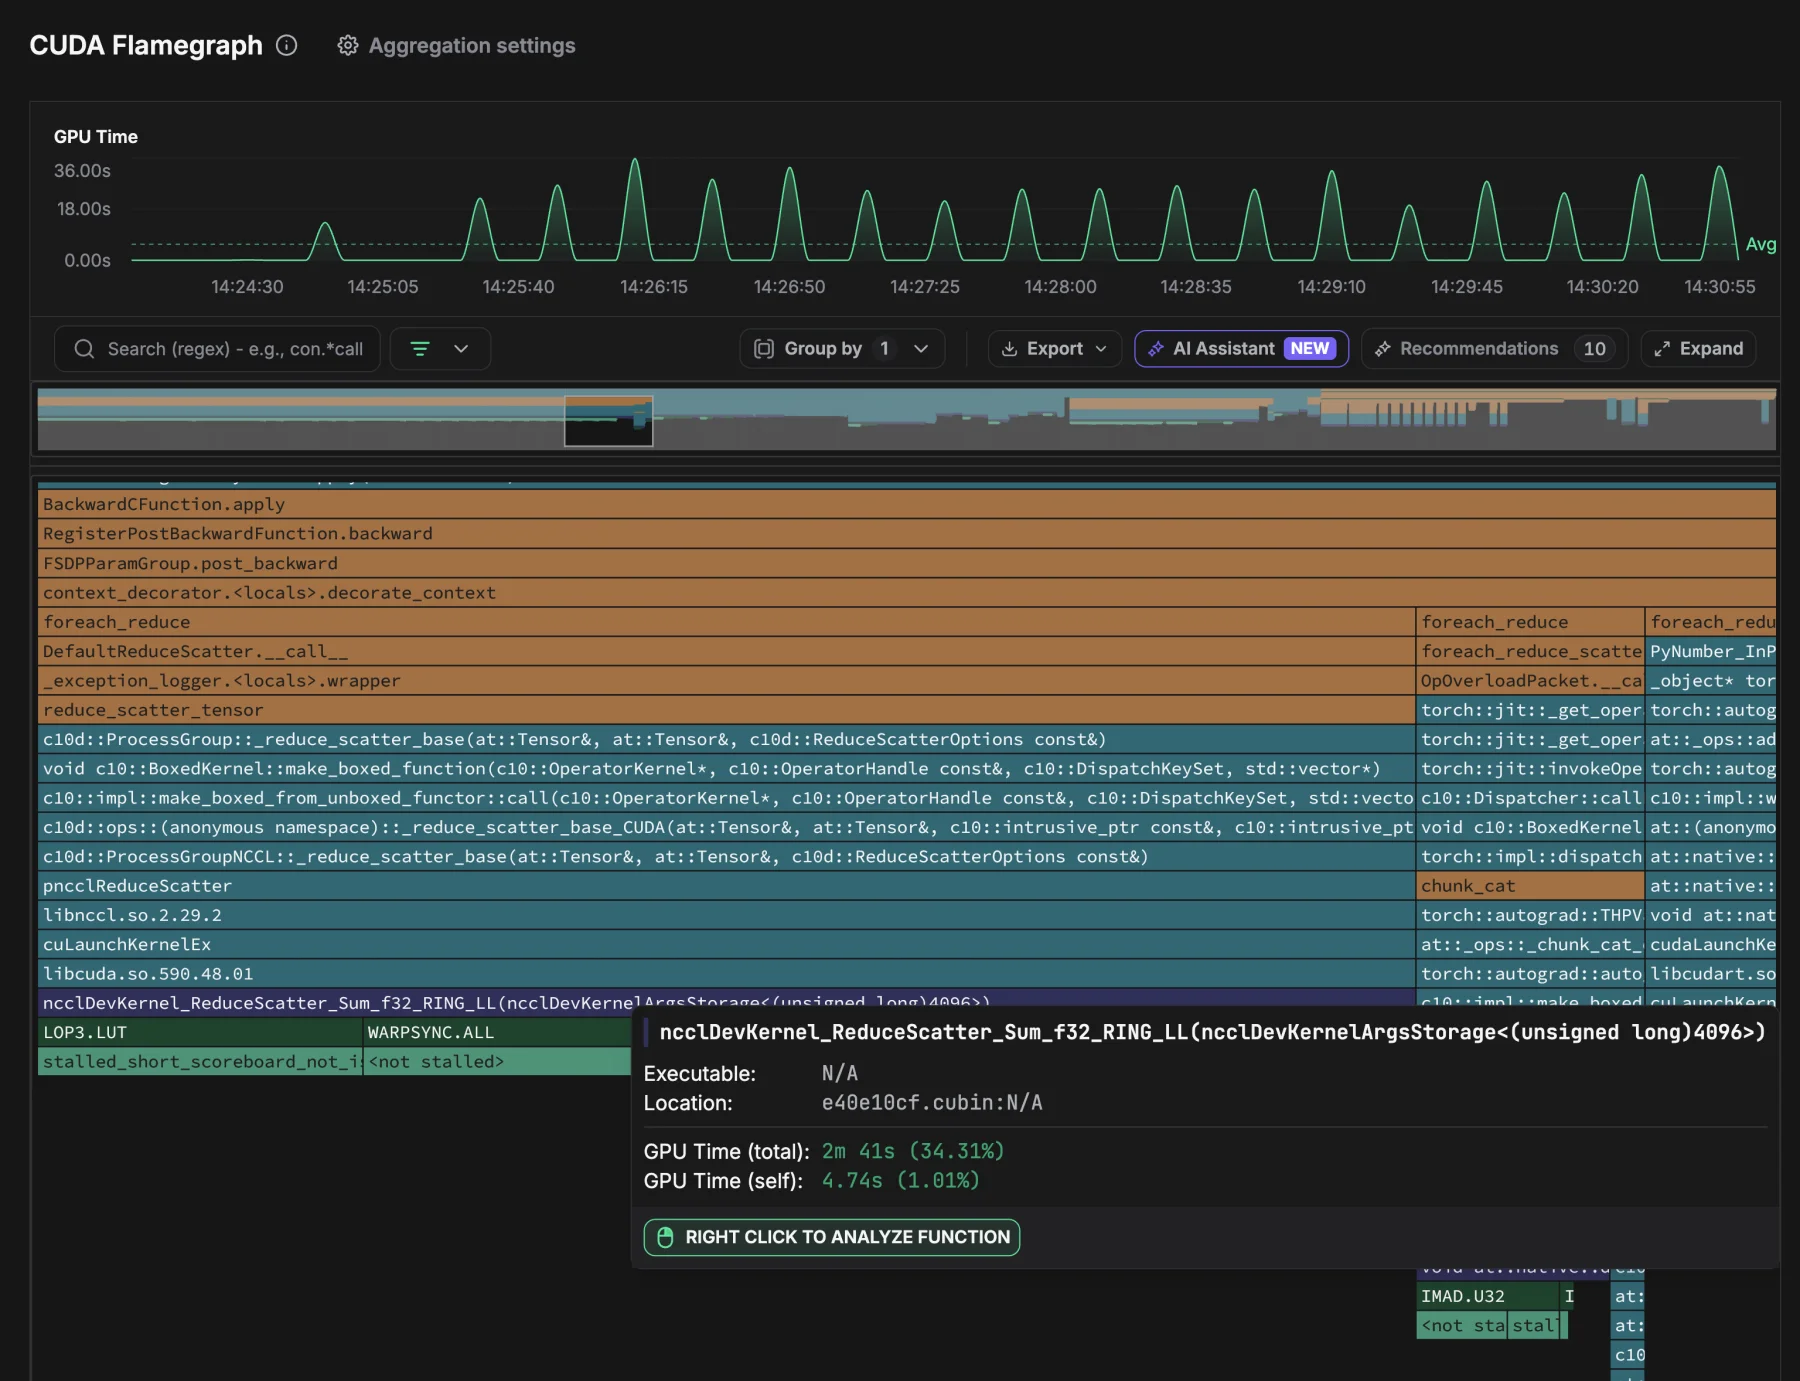
From any straggler or slow operation, you can drill down into the GPU and CPU flamegraphs for the same time range. The CUDA flamegraph shows the full stack, from the line of code that called the collective, through your framework and NCCL, to the GPU kernel it launched. See the example.
The NCCL metrics behind these findings are available as well. Use them to see how your GPUs communicate and to spot bottlenecks that never trigger a finding, such as a collective that has always been slow. Together, the findings and the metrics show where your jobs lose time to communication, which GPU or collective is responsible, and the likely cause.
Enabling Straggler Detector
Straggler detection is off by default and requires NCCL 2.27 or newer. We recommend turning it on for every multi-GPU job.
Setting the Environment Variable
Set ZYMTRACE_CUDAPROFILER__NCCL=true in your job's environment. Every process in the job needs it; launchers such as torchrun pass it on to the worker processes they start. For the other CUDA profiler settings, see GPU Profiler Variables.
- SLURM
- Kubernetes (Helm)
- Docker
- Binary
In your batch script, export ZYMTRACE_CUDAPROFILER__NCCL="true". srun passes it on to every task by default:
#!/bin/bash
#SBATCH --nodes=2
#SBATCH --ntasks-per-node=8
#SBATCH --gpus-per-node=8

export CUDA_INJECTION64_PATH="/opt/zymtrace/profiler/libzymtracecudaprofiler.so"
export ZYMTRACE_CUDAPROFILER__NCCL="true"

srun python train.py
In your job's manifest, add ZYMTRACE_CUDAPROFILER__NCCL to the container's env list:
spec:
  template:
    spec:
      containers:
        - name: trainer
          image: <YOUR_IMAGE>
          command: ["torchrun", "--nproc-per-node=8", "train.py"]
          env:
            - name: CUDA_INJECTION64_PATH
              value: /opt/zymtrace/profiler/libzymtracecudaprofiler.so
            - name: ZYMTRACE_CUDAPROFILER__NCCL
              value: "true"
          resources:
            limits:
              nvidia.com/gpu: 8
          volumeMounts:
            - name: zymtrace-profiler
              mountPath: /opt/zymtrace/profiler
              readOnly: true
      volumes:
        - name: zymtrace-profiler
          hostPath:
            path: /var/lib/zymtrace/profiler
            type: Directory
Add -e ZYMTRACE_CUDAPROFILER__NCCL="true" to your docker run command:
docker run --gpus all \
  -v /var/lib/zymtrace/profiler:/opt/zymtrace/profiler:ro \
  -e CUDA_INJECTION64_PATH="/opt/zymtrace/profiler/libzymtracecudaprofiler.so" \
  -e ZYMTRACE_CUDAPROFILER__NCCL="true" \
  --ipc=host \
  --rm -d \
  <YOUR_IMAGE> \
  torchrun --nproc-per-node=8 train.py
Add ZYMTRACE_CUDAPROFILER__NCCL="true" to the environment of the command that launches your job:
env CUDA_INJECTION64_PATH="/opt/zymtrace/profiler/libzymtracecudaprofiler.so" \
    ZYMTRACE_CUDAPROFILER__NCCL="true" \
    torchrun --nproc-per-node=8 train.py
Straggler detection and NCCL metrics don't need CUDA profiling, so ZYMTRACE_CUDAPROFILER__NCCL=true works on its own. The examples above also set CUDA_INJECTION64_PATH, which turns on CUDA profiling. Drilling down from a straggler to its CUDA flamegraph needs CUDA profiling, so we recommend setting both.
Using the Zymtrace UI
If the profiler injects the CUDA profiler for you through automatic injection, turn on straggler detection in a CUDA profiler rule instead. The rule's GPU Profiler Config applies only to processes the profiler injects; processes that load the profiler through CUDA_INJECTION64_PATH ignore it.
- Open Settings → Agent Config, select the CUDA Profiler tab, and click + Add Rule.
- Enter a CEL expression that matches the hosts or processes running your job, or leave it empty to match all agents.
- Turn on Inject CUDA Profiler.
- Under GPU Profiler Config, click Add override, select NCCL collection, and set it to Enabled.
- Click Add.
Using Straggler Detector
The Stragglers & Collectives page lists stragglers and slow operations for the selected time range and shows both on a timeline. From each one, you can drill down to the code behind it.
Stragglers
To detect stragglers, Zymtrace's detection algorithm analyzes the per-rank NCCL metrics of each communicator. To find the likely cause, it compares each GPU's SM clock with its peers', checks clock throttle reasons such as an active power cap, and looks for NVLink errors.
The overview lists the three worst stragglers in the selected time range. Each entry names the late GPU, its host, and its communicator, along with its waiting share: how much of the other GPUs' time in collectives goes to waiting for it.
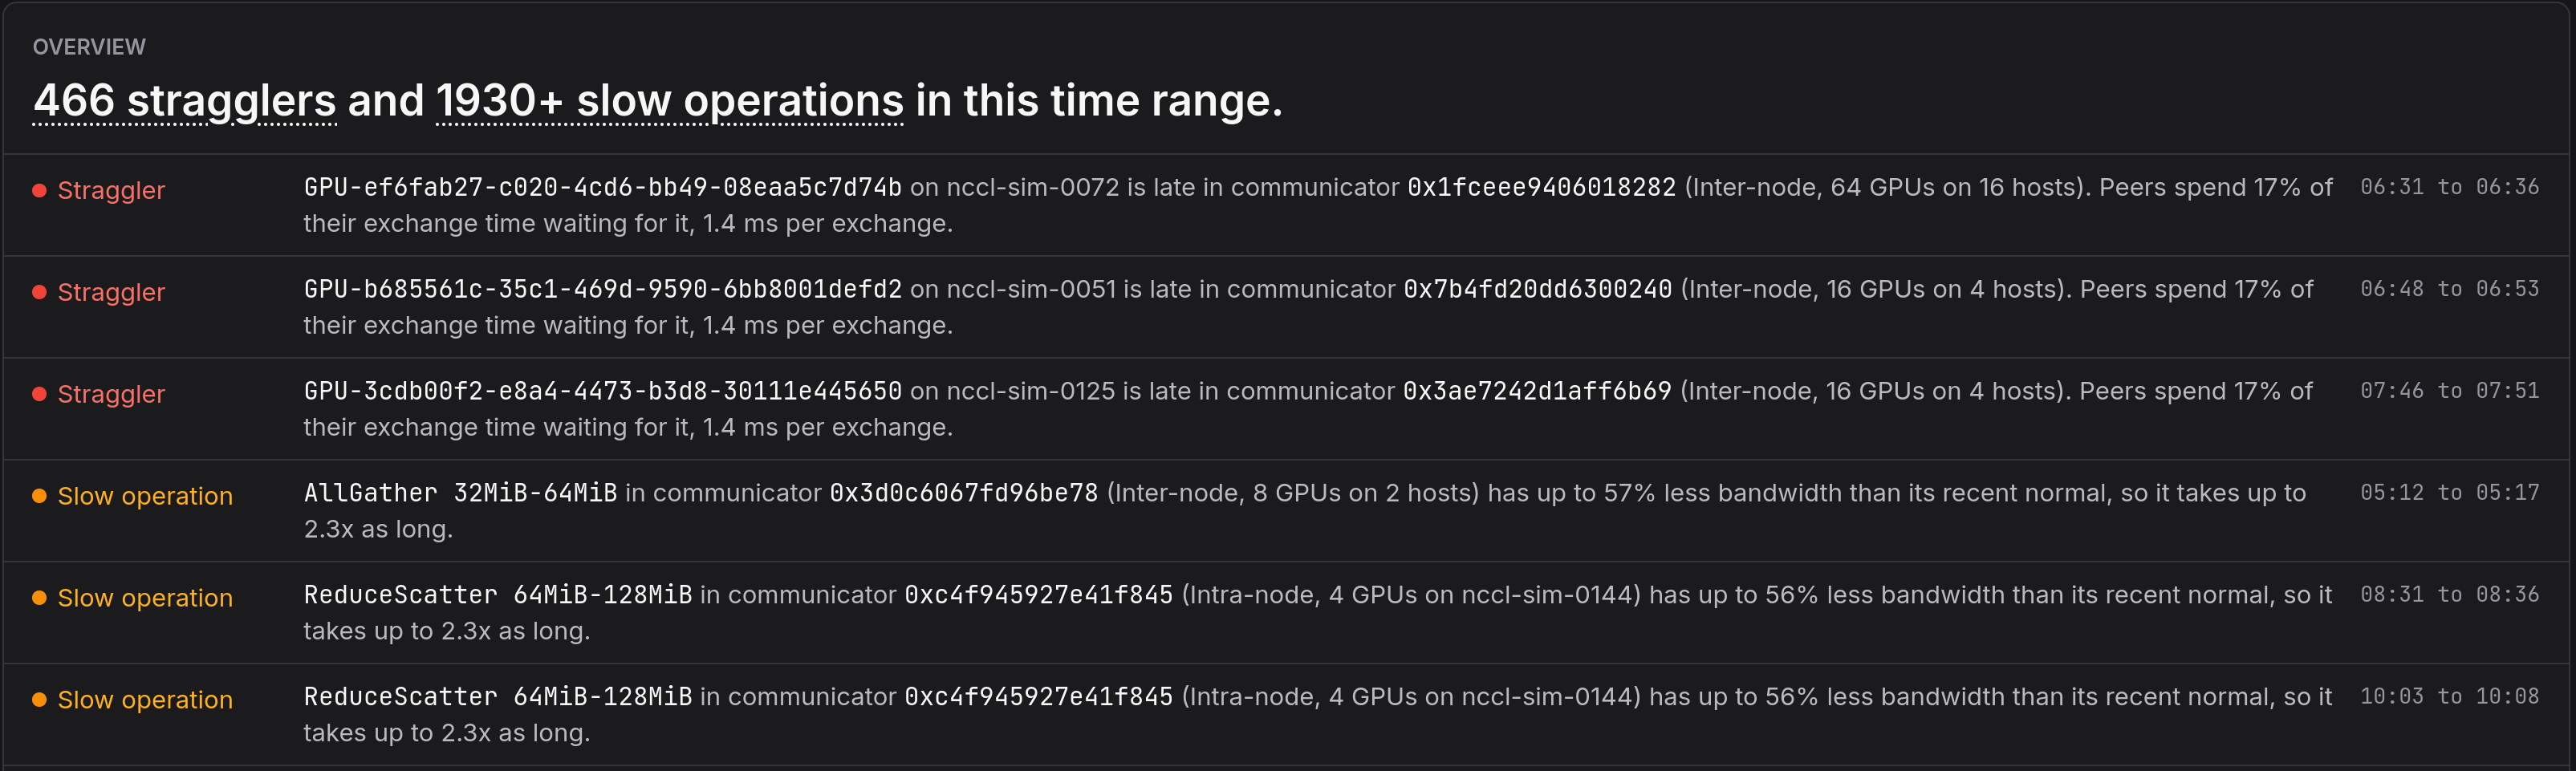
Scroll down for the full list of stragglers. Click a straggler to open a side pane with its GPU rank, its communicator, and how long the other GPUs wait for it:
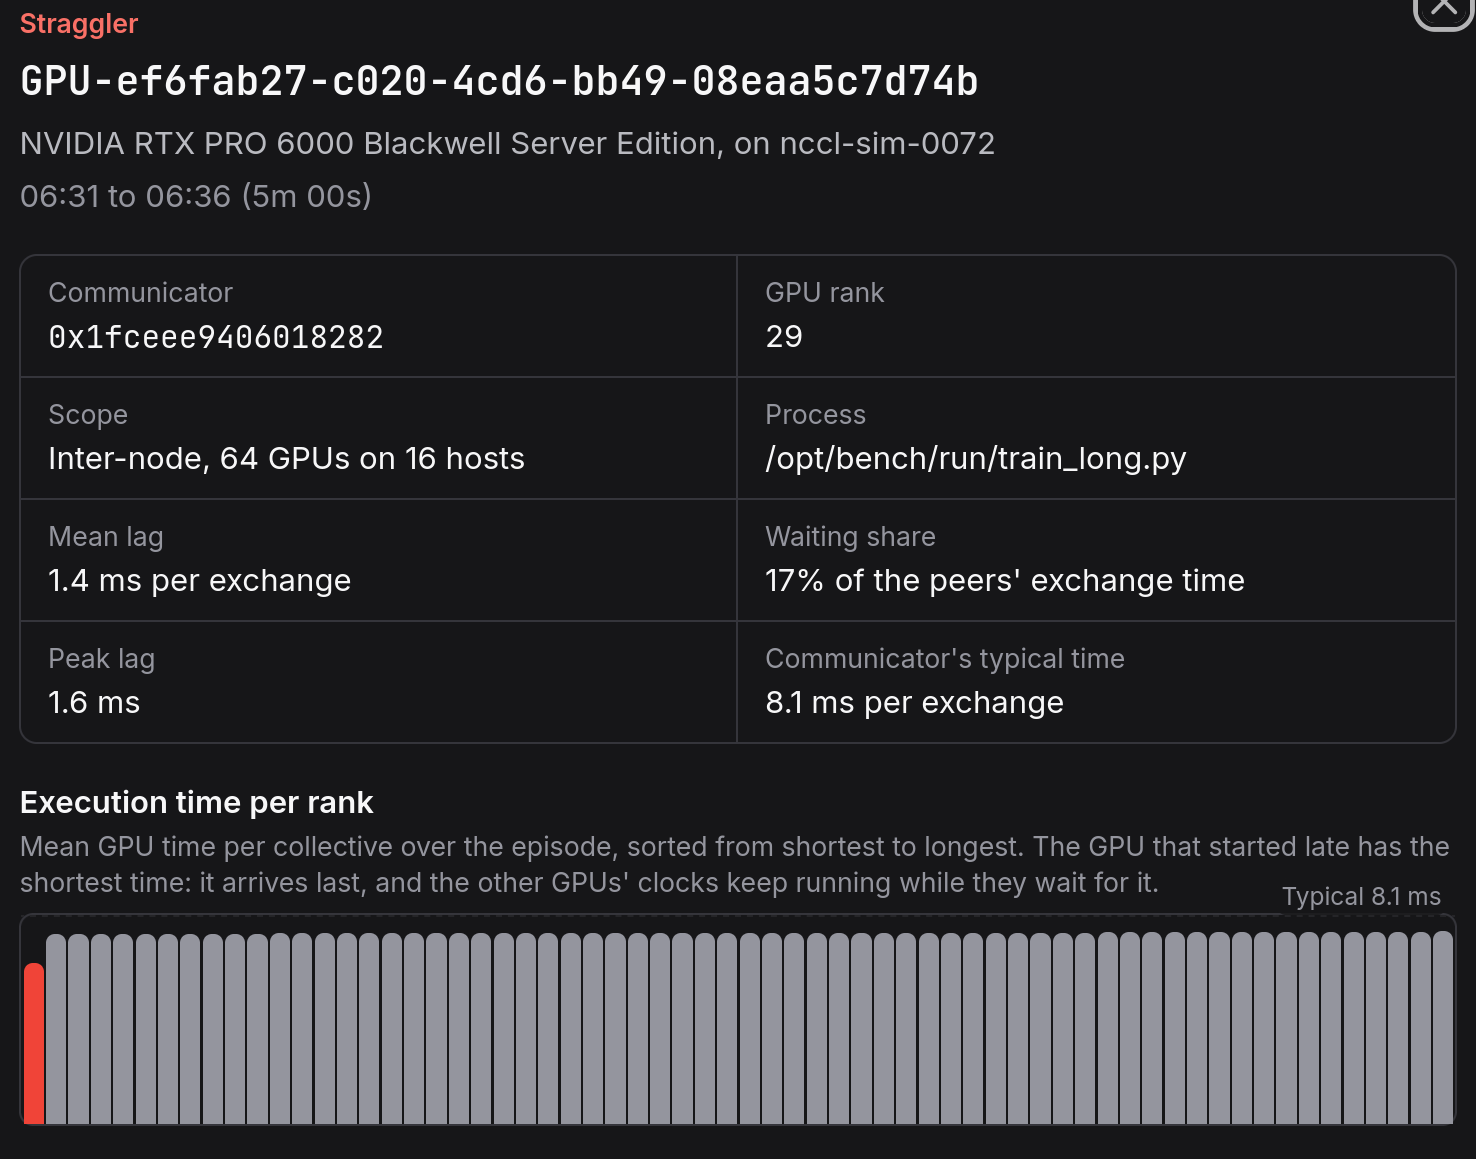
The Execution time per rank chart compares the straggler with the other ranks in its communicator and shows whether more than one GPU is falling behind. The late GPU has the shortest execution time, not the longest: it arrives last and doesn't have to wait, while the time the other GPUs spend waiting for it counts toward their execution time.
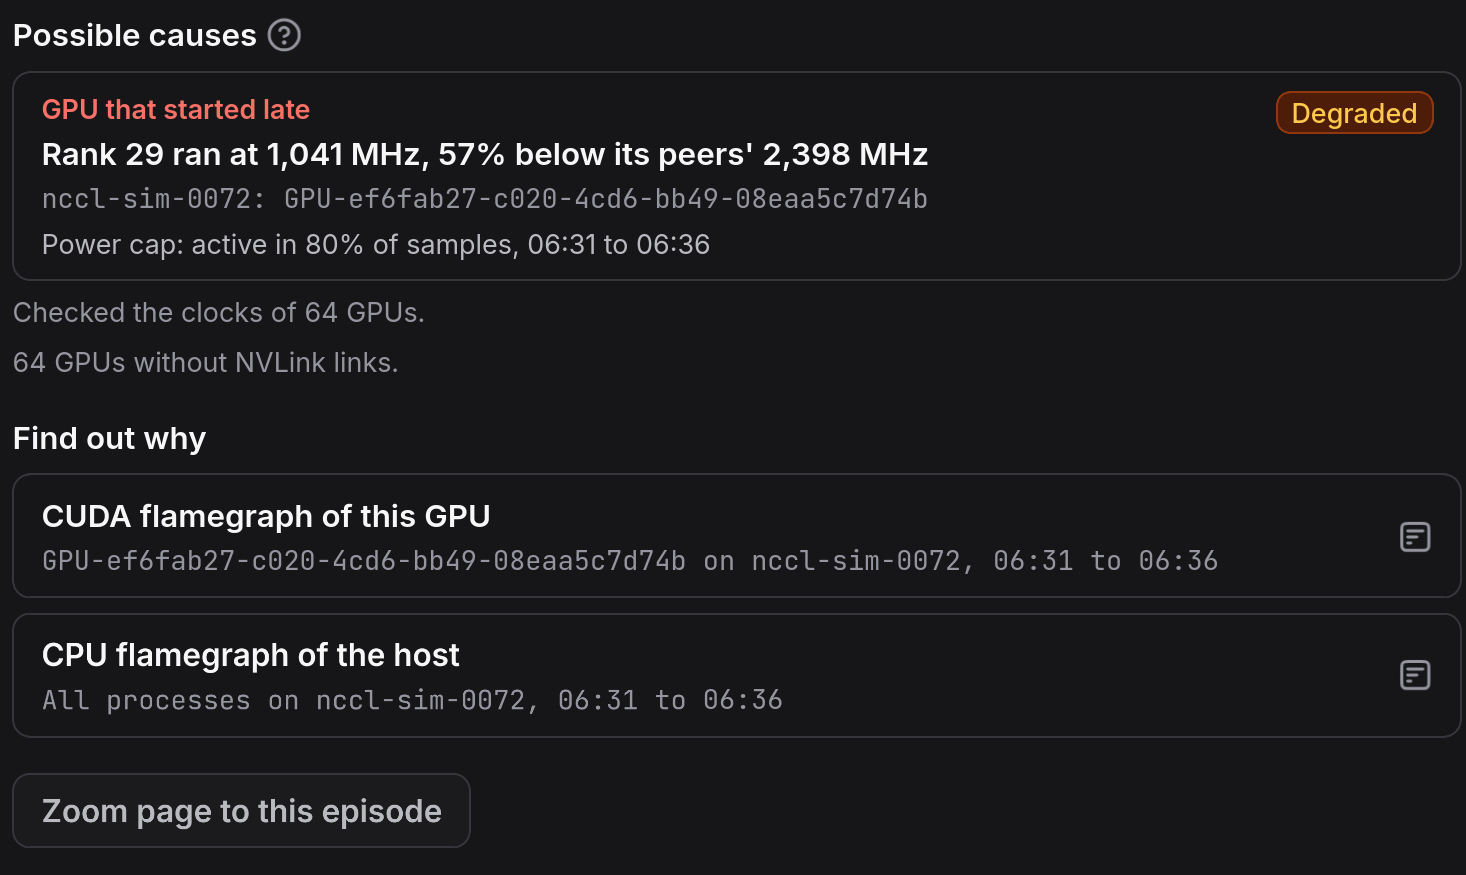
At the bottom of the side pane, Possible causes lists issues that could explain the straggler. In the example below, the GPU at rank 29 ran at 1,041 MHz, 57% below its peers' 2,398 MHz, with its power cap active in 80% of samples.
To confirm the cause, Find out why links to the CUDA flamegraph of the late GPU and the CPU flamegraph of its host, both covering the straggler's time range. To zoom the NCCL metrics and stragglers to the same time range, click Zoom page to this episode.
Slow Operations
A collective can also slow down without any GPU arriving late, for example when all the GPUs in a communicator slow down together. Such a slowdown doesn't show up as a straggler, so Zymtrace also tracks the bandwidth of each collective (such as AllReduce or AllGather) per communicator and message size range, and flags a slow operation when that bandwidth drops well below its recent normal.
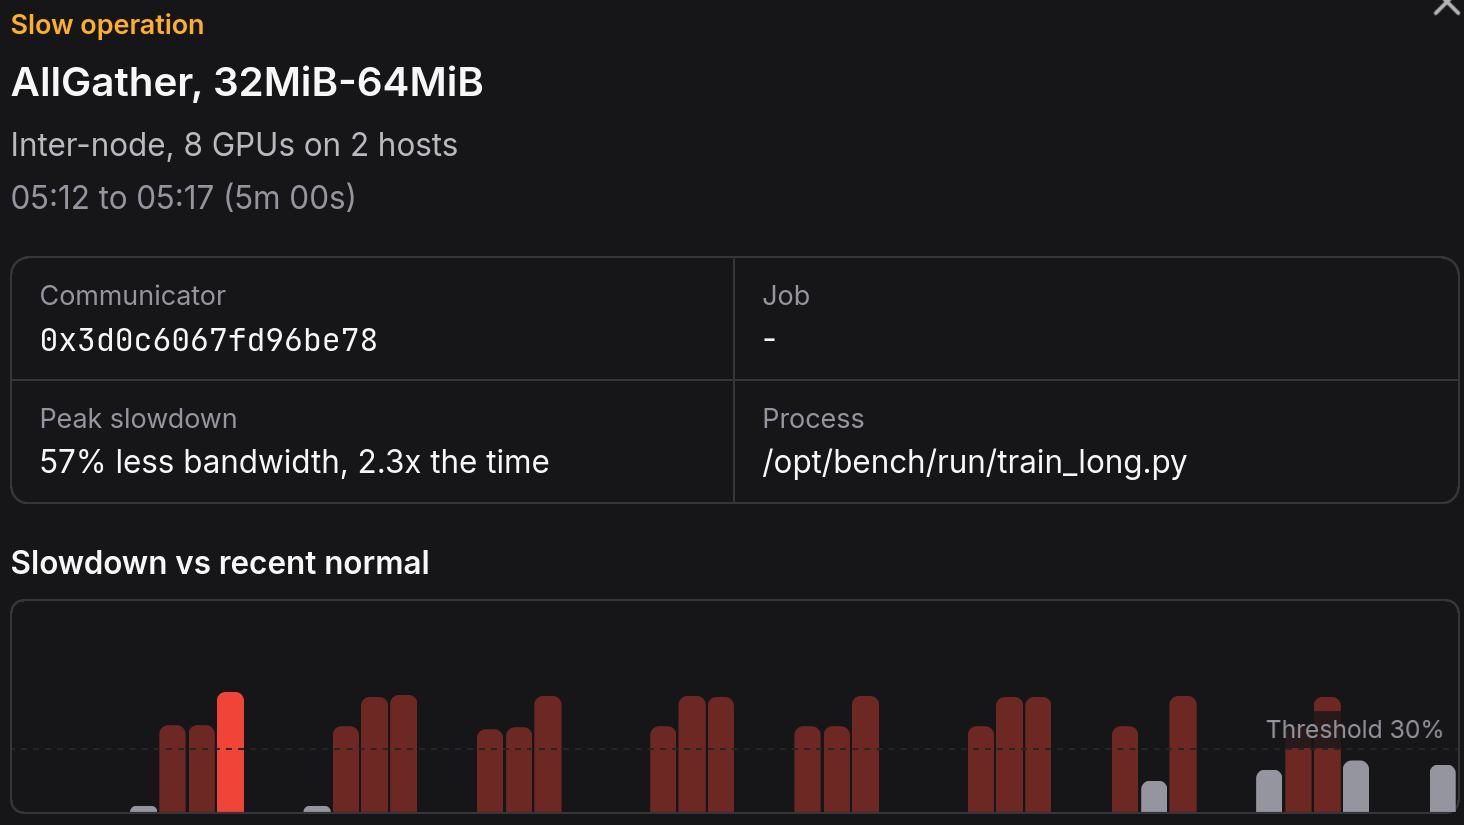
Click a slow operation to open a side pane like the one for stragglers, with details, possible causes, and links to flamegraphs. Instead of a GPU, it names the collective that slowed down and the size range of the messages it was transferring. The Slowdown vs recent normal chart shows when the collective slowed down and by how much.
Timeline
The timeline shows stragglers and slow operations across the selected time range. Each bar covers an equal slice of that range. In the Stragglers row, it shows the worst waiting share in any communicator during that slice; in the Slow operations row, the worst bandwidth drop versus recent normal. Drag across the bars to filter the tables below to that window, then click Zoom to selection to see it at a finer granularity.

Drilling Down to the Code
From a straggler or a slow operation, Find out why takes you to the CUDA flamegraph for the same time range. The flamegraph follows every GPU kernel back to the code that launched it, so you can see which call in your job spends GPU time in NCCL, and how much.
In the example below, the backward pass of a PyTorch FSDP training job (FSDPParamGroup.post_backward) calls reduce_scatter_tensor, which reaches NCCL through ProcessGroupNCCL. The kernel that NCCL launches, ncclDevKernel_ReduceScatter_Sum_f32_RING_LL, accounts for 2 minutes 41 seconds of GPU time, 34% of the time in the flamegraph. Below the kernel, the flamegraph breaks that time down into GPU instructions and stall reasons.
Monitoring NCCL Health
Zymtrace collects NCCL metrics per GPU and per communicator: bus bandwidth, execution time, and message size for each collective, plus the per-rank counts and bandwidth it uses to detect stragglers. You can filter them alongside the NVIDIA GPU metrics.
For the complete list (every metric key, unit, and attribute), see the Metrics Reference.